
Figure 2.
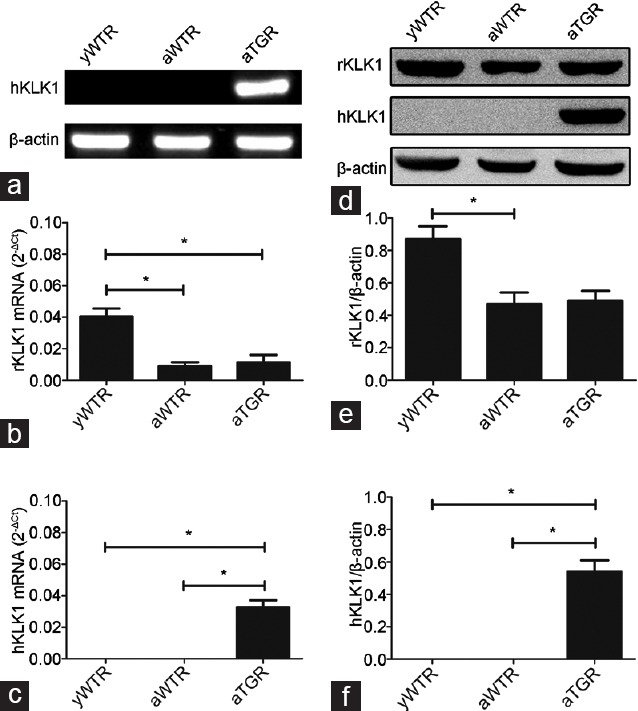
Verification of expressions of hKLK1 and rKLK1 genes in the corpus cavernosum. (a) Representative hKLK1 genomics DNA bands in rats’ corpus cavernosum by agarose gel electrophoresis followed by conventional PCR. Relative mRNA expressions of rKLK1 (b) and hKLK1 (c) with β-actin as the loading control in the corpus cavernosum of three groups by real-time RT-PCR. (d) Representative Western blotting results of rKLK1, hKLK1, and β-actin in the corpus cavernosum of three groups. Expressions of rKLK1 (e) and hKLK1 (f) with β-actin as the loading control in the corpus cavernosum of three groups were presented through bar graphs. Data are expressed as mean ± s.d. (n = 10 rats per group). *P < 0.05 when comparing the two groups under each end of the capped line. RT-PCR: reverse transcriptase PCR.