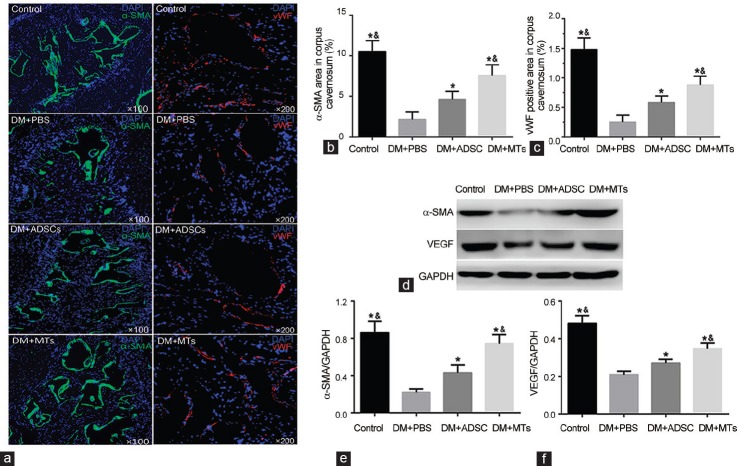
Figure 4.
Smooth muscle and endothelium content. (a) Representative histological images of smooth muscle and endothelium in corpus cavernosum of each group indicated by α-SMA and vWF, respectively. Original magnification: ×100, ×200. Quantitative data of smooth muscle (b) and endothelium (c) are shown in right column bar graph. (d) Protein levels of α-SMA and VEGF are quantified as α-SMA/GAPDH (e) and VEGF/GAPDH (f) and expressed as mean ± standard deviation. *P < 0.05 compared with DM + PBS group. &P < 0.05 compared with DM + ADSCs group.

