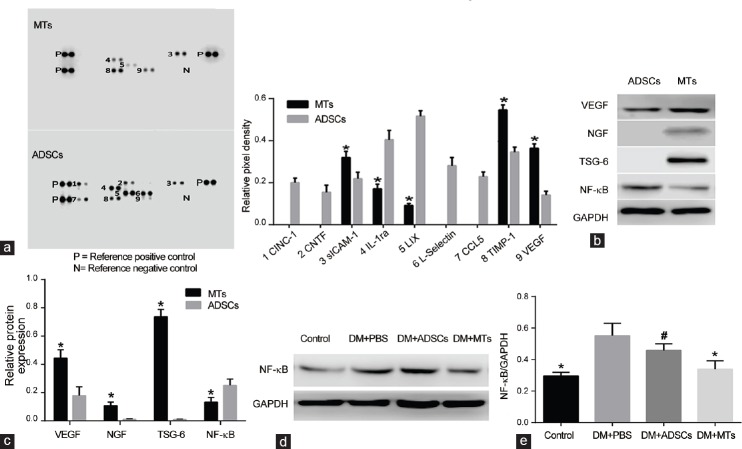
Figure 6.
Rat cytokine array analysis of ADSCs and MTs lysates. (a) Rat cytokine array analysis of MTs and ADSCs lysates showed that nine proteins were detected in ADSCs lysate while five proteins were detected in MTs lysate. Protein levels are showed as relative pixel density and quantified by positive control. *P < 0.05 compared with ADSCs lysate. (b) Western blot analysis of VEGF, NGF, TSG-6, and NF-κB contents in ADSCs and MTs. (c) Protein levels are quantified by VEGF/GAPDH, NGF/GAPDH, TSG-6/GAPDH, and NF-κB/GAPDH. *P < 0.05 compared with ADSCs. (d) Western blot analysis of NF-κB expression in penis of each group and (e) protein levels are quantified by NF-κB/GAPDH. *P < 0.05 compared with DM + PBS or DM + ADSCs group. #P > 0.05 compared with DM + PBS group.

