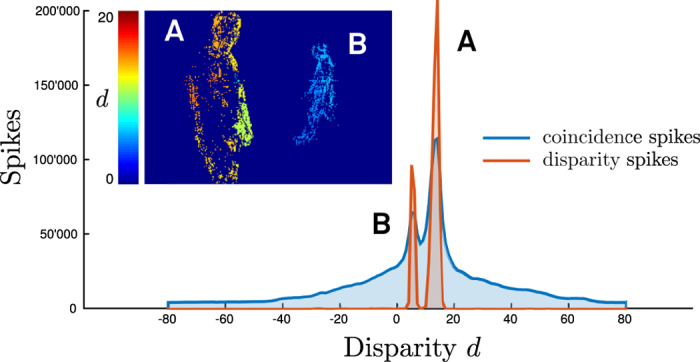
Figure 3. Inhibition of ambiguity in the stereo network.

Spiking activity of coincidence (blue) and disparity (brown) detectors at varying disparities accumulated over the full duration of the walking scene. The inset shows a disparity map generated from a short section of the scene. The two people are labeled (A) and (B) accordingly.
