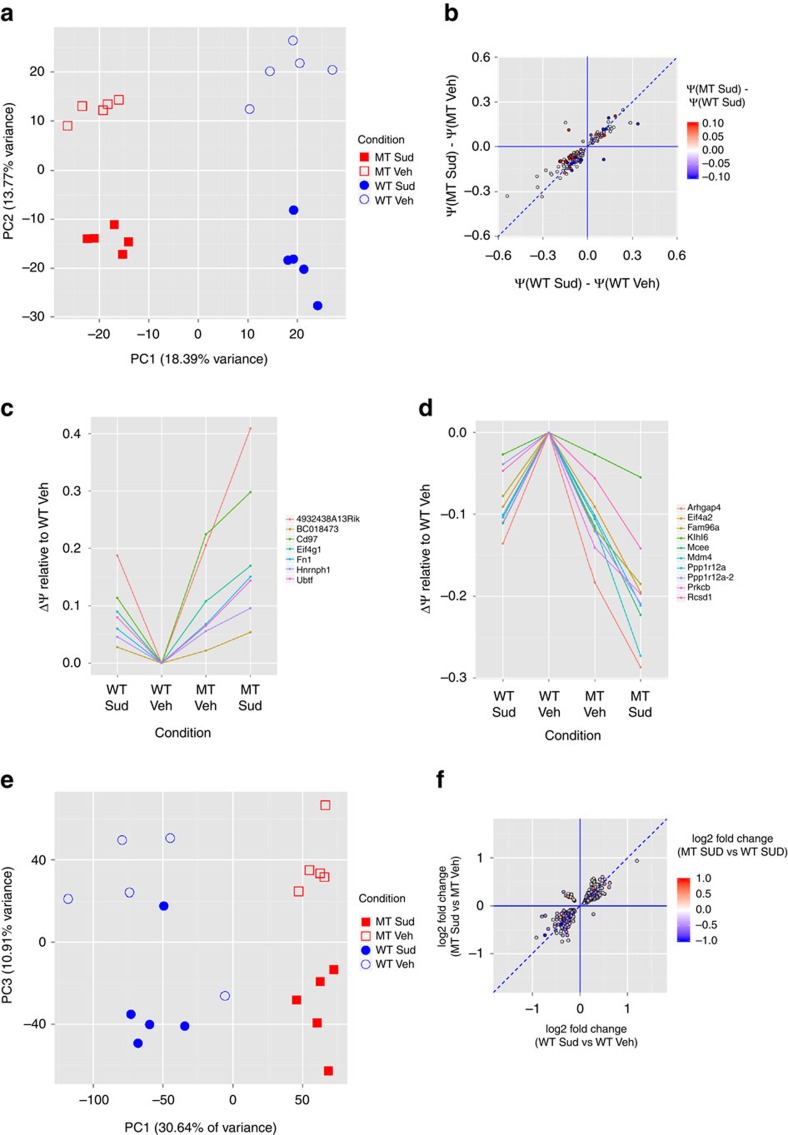
Figure 4. Sudemycin D6 treatment alters splicing and gene expression in mutant U2AF1-haematopoietic cells.
RNA sequencing and transcriptome analysis was performed on RNA harvested from mouse bone marrow cells expressing mutant U2AF1(S34F) or U2AF1(WT) following treatment of mice with sudemycin D6 (50 mg kg−1) or vehicle control for 5 days (n=5 per genotype and treatment). (a) PCA of normalized expression of skipped cassette exon events. (b) Correlation between sudemycin-induced changes relative to vehicle treatment in cassette exons of U2AF1(WT) cells  (FDR<10%) and of mutant U2AF1(S34F) cells
  (FDR<10%; R2=0.8; P<2.2 × 10⁻¹⁶, F-test). Dashed line indicates similar effects in U2AF1(WT) and U2AF1(S34F) cells
  . Colour scale indicates cumulative splicing changes of U2AF1(S34F) expression with sudemycin treatment (that is,
  ), with red being a positive change, blue being a negative change, and white being no difference between sudemycin-treated U2AF1(S34F) and U2AF1(WT) cells. (c,d) Delta PSI (
 ) for each condition on the horizontal axis relative to vehicle-treated U2AF1(WT) cells ((
 )=0) for events that are significantly dysregulated across all five comparisons (see Supplementary Methods), have concordant sudemycin-induced dysregulation across genotype (that is,
  and
and  have the same direction), and in which the sudemycin effect is exacerbated by mutation. The cumulative effect on cassette exons induced by both mutant U2AF1 and sudemycin D6 treatment relative to vehicle-treated WT cells,
  , may result in increased exon skipping (positive values, c) or increased exon inclusion (negative values, d). (e) PCA of normalized expression of expressed genes. (f) Correlation between sudemycin-induced changes relative to vehicle treatment (expressed as log2 fold changes, FDR<10%) in U2AF1(WT) and U2AF1(S34F) cells (R2=0.8; P<2.2 × 10⁻¹⁶, F-test). Dashed line indicates log2 fold changes induced by sudemycin are the same in U2AF1(WT) and U2AF1(S34F) cells. Colour scale indicates cumulative contribution of mutant U2AF1 expression to sudemycin-induced gene expression changes, that is, log2 fold change of gene expression altered by sudemycin in mutant U2AF1(S34F) cells relative to U2AF1(WT) cells, with red being a positive change, blue being a negative change and white being no difference. U2AF1 mutant (MT), sudemycin D6 (Sud), U2AF1 WT, vehicle (Veh), principal component 1 (PC1), principal component 2 (PC2), principal component 3 (PC3), per cent spliced in (PSI, Ψ).

