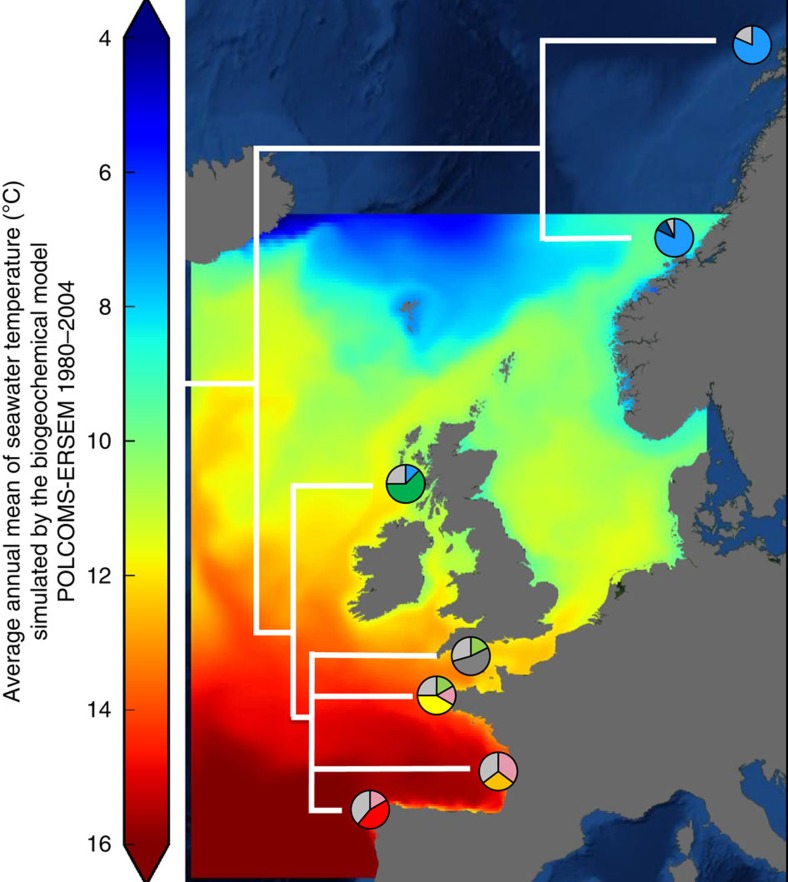
Figure 1. Genetic structure of Littorina littorea populations.
Thermal map of Europe from the POLCOMS-ERSEM biogeochemical model showing sampling locations and genetic structure of the six different populations of L. littorea sampled across the Northwest Atlantic latitudinal gradient (from 42° to 70°): pie chart position indicates location of collection of specimens, from south to north: Vigo (Spain), Île de Ré (France), Roscoff (France), Plymouth (UK), Millport (UK), Trondheim (Norway), Tromsø (Norway). Neighbour-joining population tree. Pie charts=proportion of common haplotypes (grey), shared between climatic regions (pastel colours, northern=blue, mid=green, southern=pink), private to individual sites (primary colours). Background image courtesy of NASA's Earth Observatory.

