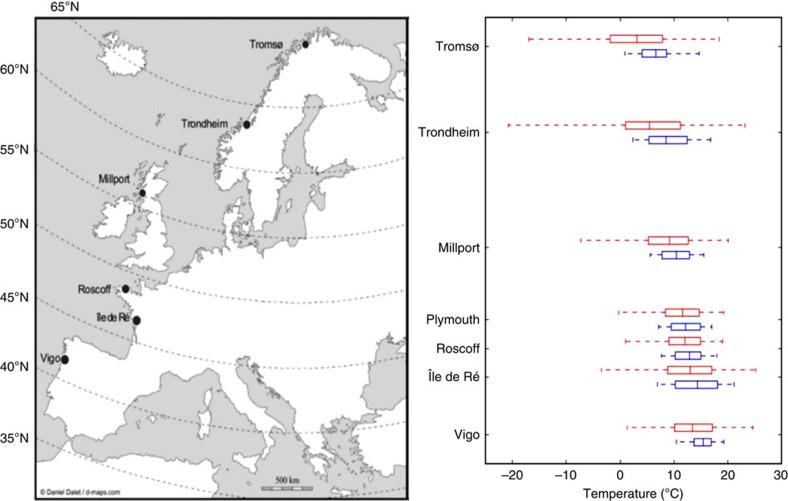
Figure 2. Collection locations for populations of Littorina littorea.
Map of Europe (left panel) with the locations (full circles) where populations of the common periwinkle Littorina littorea (Linnaeus, 1758) were collected from along the Western coastline of Europe during June to August 2010. Horizontal boxes indicate population mean values for temperature (central vertical line) of sea-surface temperature (SST): blue dashed line, and land-surface temperature (LST): red dashed line. The edges define the 25th and 75th percentiles, and error bars represent 95% CI. Temperature data were obtained from the National Oceanic and Atmospheric Administration/National Aeronautics and Space Administration (http://podaac.jpl.nasa.gov/) and comprised the mean annual SSTs for the 5-year period 2005–2009, measured across latitudes from 5.07 to 15.47 °C. Average annual (LSTs were obtained from World Climate (http://www.worldclimate.com/). Map outline courtesy of http://www.d-maps.com/.

