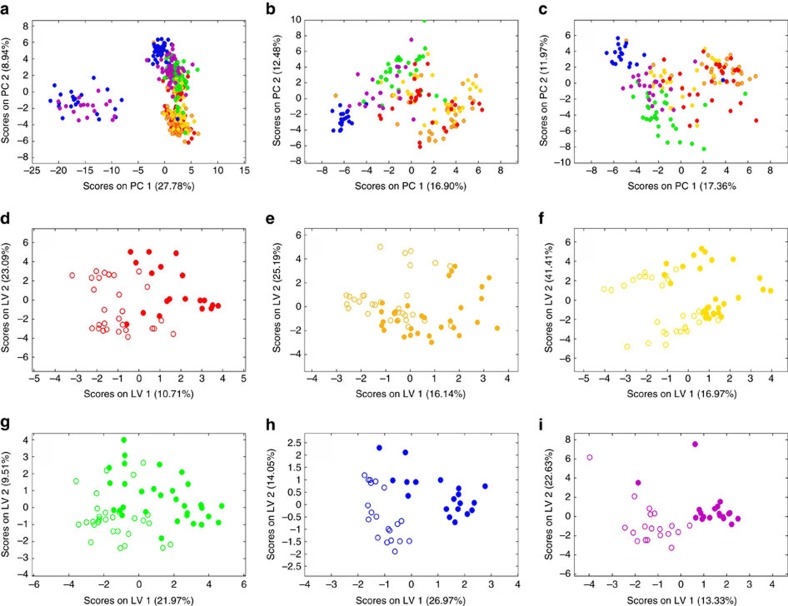
Figure 4. Metabolomic profiling of Littorina littorea populations.
PCA score plots for (a) all populations (both Pco2) (Vigo-red, Île de Ré-orange, Roscoff-yellow, Millport-green, Trondheim-blue, Tromsø-purple). (b) Control Pco2. (c) Elevated Pco2. (d) Vigo, (e) Île de Ré, (f) Roscoff, (g) Millport, (h)Trondheim, (i)Tromsø PLS-DA score plots for forward selected metabolomic profiles for each population (individual data, n=30). Open circles indicate current Pco2 and filled circles indicate elevated Pco2.

