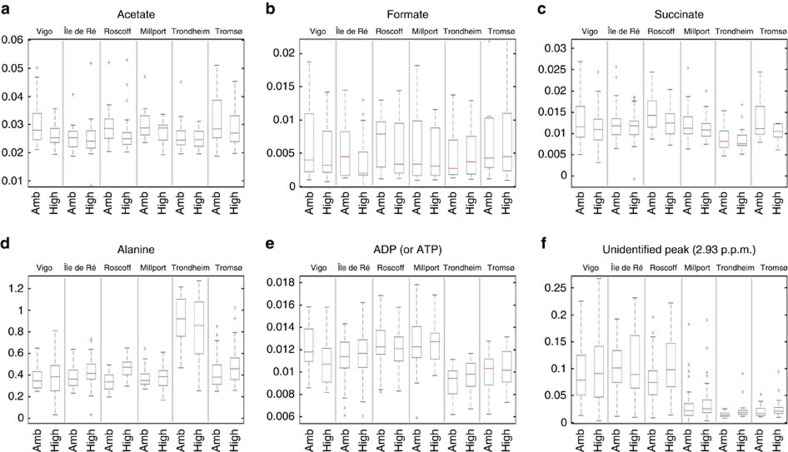
Figure 5. Metabolite concentrations of Littorina littorea populations.
(a) Acetate, (b) formate, (c) succinate, (d) alanine, (e) ADP (or ATP), (f) unidentified peak at 2.93 p.p.m. Boxplots describing the integrated peak areas for peaks of interest from each location sampled at different Pco2 conditions. Vertical boxes indicate population mean values for metabolites (central horizontal line), the edges define the 25th and 75th percentiles and error bars represent 95% CI. The symbol ‘+' represents outlier data. The y axis is given in mmol−1.

