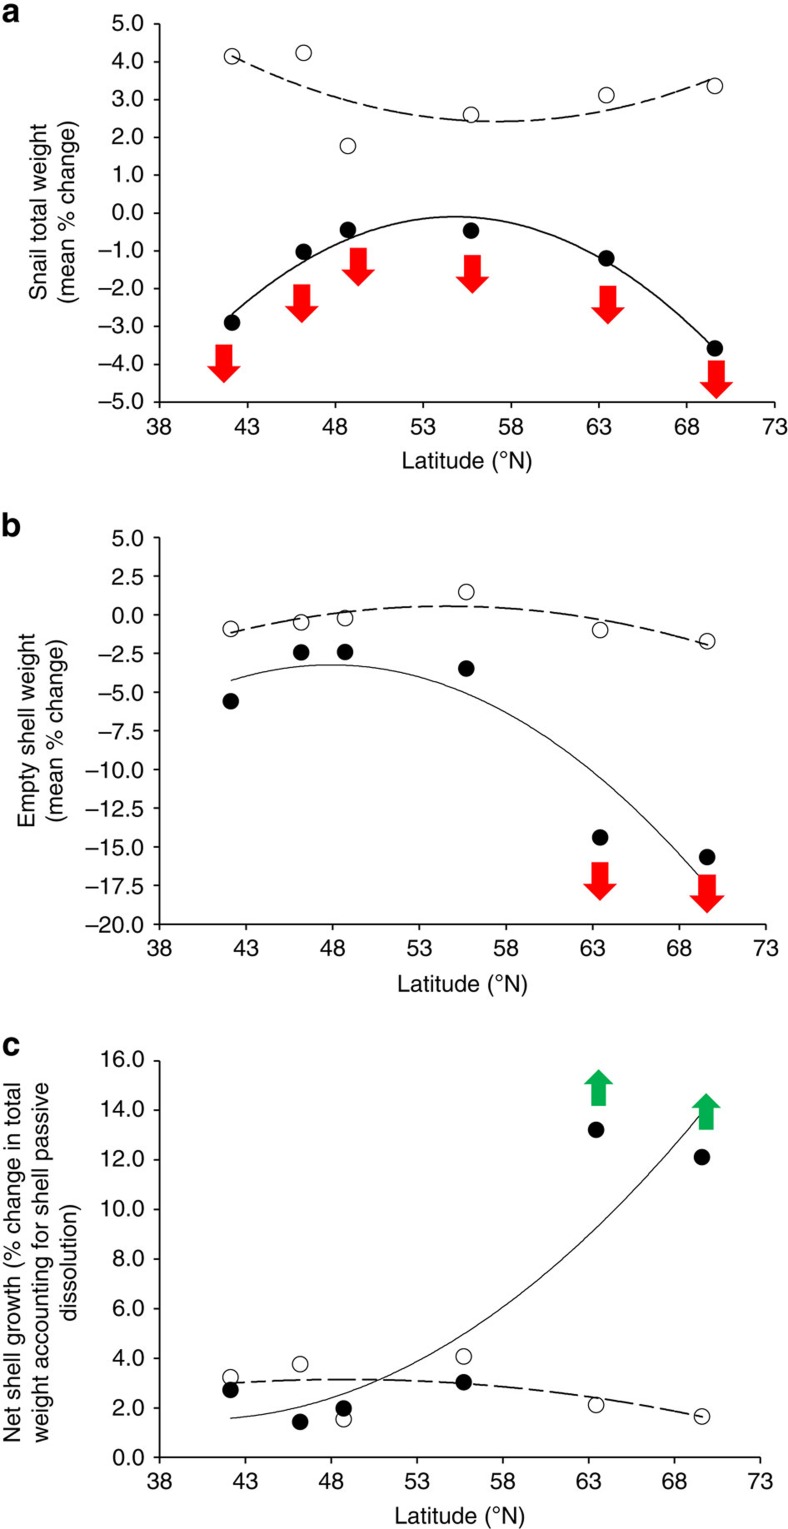
Figure 6. Relationship between latitude and growth of L. littorea populations.
(a) Mean total snail weight, current Pco2, best-fit regression approach r5=0.66, P=0.104, y=0.008x2−0.867x+27.242, elevated Pco2, r5=0.98, P<0.001, y=−0.016x2+1.753x−48.143. (b) Mean empty shell weight, current Pco2, best-fit regression approach r5=0.85, P=0.016, y=−0.011x2+1.210x−32.369, elevated Pco2, r5=0.93, P=0.002, y=−0.030x2+2.910x−72.874. (c) Growth effort (mean total snail weight–mean empty shell weight), current Pco2, best-fit regression approach r5=0.54, P=0.212, y=−0.004x2+0.340x−5.130, elevated Pco2, r5=0.91, P=0.004, y=0.010x2−1.150x+24.730. Population mean data, n=6; population collection location latitudinal position provided along the x axis. White circles and dotted line indicate current Pco2 and black circles and full line indicate elevated Pco2. Arrows indicate within-population significant increases (green) or decreases (red) (P<0.05, ANOVA test) between current and elevated Pco2, and maximum divergence from control conditions observed among all populations using post hoc Bonferroni test of one-way ANOVA (P<0.05), according to 95% confidence interval test for estimate marginal means (EMM) with Bonferroni correction as reported by Melatunan59.

