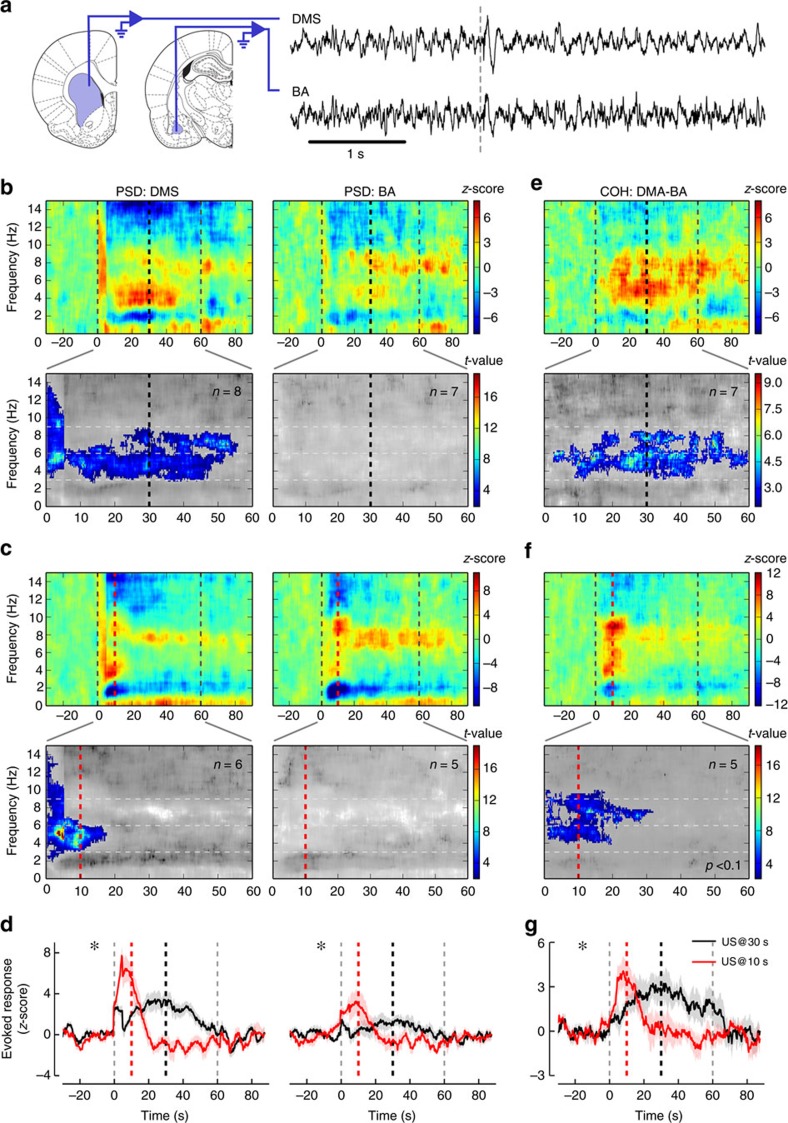
Figure 2. Time-related oscillatory changes in the 3–6 Hz frequency band recorded from DMS and BA during CS alone presentations.
(a) Sketch of the recording locations for dorso-medial striatum (DMS, left) and basal amygdala (BA, middle), adapted, with permission, from drawings published in ref. 64. Raw traces of the simultaneously recorded local field potentials in the DMS (right, upper trace) and the BA (right, lower trace) before and during CS presentation (onset marked by dashed grey line). (b) Relative change in LFP power for the DMS (upper left) and the BA (upper right) before, during and after 60 s CS presentation (onset and offset marked by dashed grey lines) when the US is expected 30 s after the CS onset (thick black dashed line). The relative change with respect to pre-stimulus baseline per frequency shows increased activity in two bands (3–6 Hz and 6–9 Hz). Non-parametric cluster analysis (lower panels) reveals significant (P<0.05) power spectrum increases for the DMS but not for the BA during CS presentation. The grey colour code depicts non-significant changes as t-values. (c) Relative change in LFP power for the DMS (upper left) and the BA (upper right) before, during and after CS presentation after the US arrival was shifted to 10 s (thick red dashed line). Same depiction as in b. (d) Comparison of the mean±s.e.m. changes in LFP power in the 3–6 Hz band between 30 s (black) and 10 s (red) expected time of US arrival conditions (DMS: left panel; BA: right panel). Stars mark significant time X condition interaction (two-way ANOVA with Geisser and Greenhouse correction; P<0.001 and P=0.01, respectively). (e) Relative change in LFP coherence between DMS and BA in the 30 s condition (upper panel). The relative change with respect to pre-stimulus baseline (60 s) per frequency shows significant increases in the theta range during the stimulus presentation (lower panel). (f) Relative change in LFP coherence between DMS and BA after the US arrival was shifted to 10 s. Same depiction as in e. (g) Comparison of the relative coherence dynamics in the 3–6 Hz frequency band between 30 s (black) and 10 s (red) expected US arrival conditions. The star marks significant time X condition interaction (two-way ANOVA with Geisser and Greenhouse correction; P<0.01).

