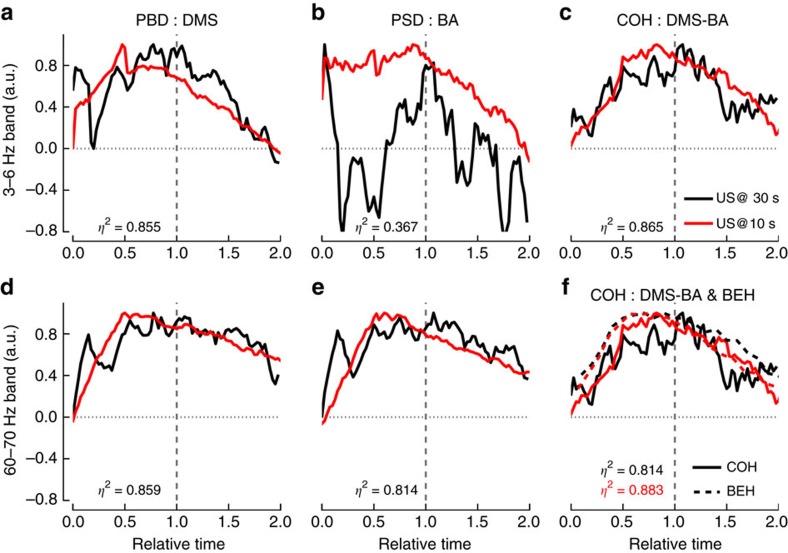
Figure 4. Superposition for coherence between DMS and BA LFP oscillations correlates with behaviour.
(a–e) The rescaled PSD in DMS (a,d), BA (b,e) and the coherence between DMS and BA (c) are shown for the 3–6 Hz (upper row, (a–c)) and the 60–70 Hz (d–e) frequency bands. After normalization of the time axis, the expected time of US arrival occurs at 1 (marked by the grey dashed line) for both the 30 s (black lines) and the 10 s conditions (red lines). η2 values between the normalized 30 s and 10 s curves (n=81 points) are given in each panel. (f) For illustrative purposes, superposition of the rescaled 3–6 Hz frequency band coherence traces (solid lines) with the normalized conditioned suppression curves (behaviour: BEH; dashed lines) for 30 s and 10 s conditions. The η2 values correspond to the superposition index between coherence and behaviour for 30 s (black, n= 60 points) and 10 s (red, n=20 points).

