
Figure 3.
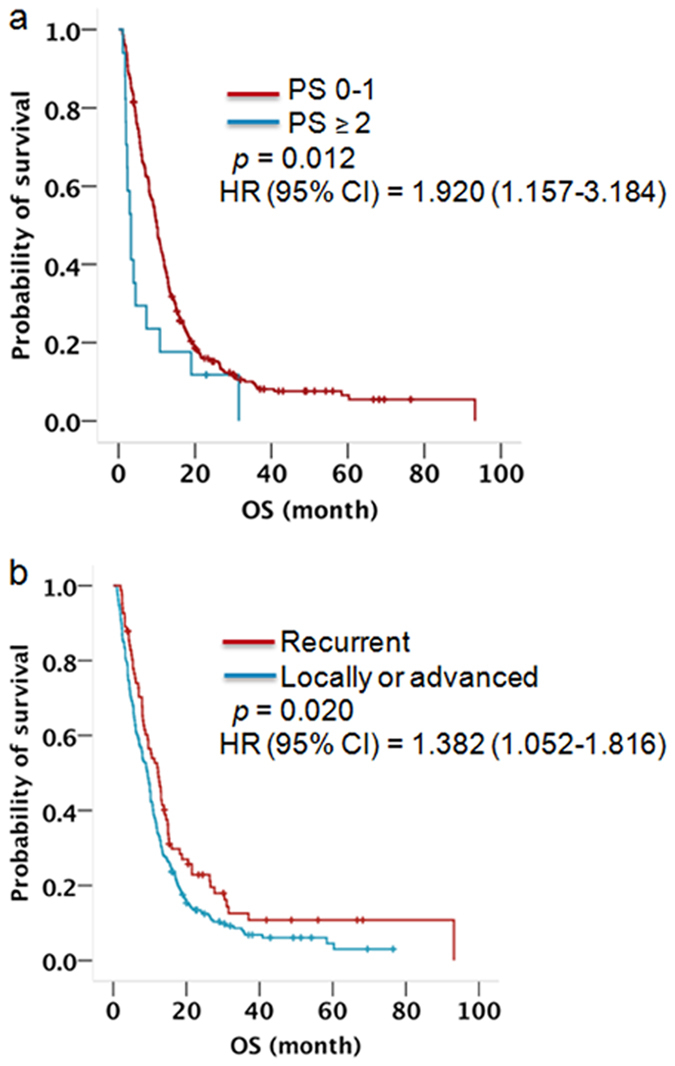
Kaplan-Meier survival curve for patients with wild-type EGFR stratified by (a) PS score, (b) disease type. P-value indicates significance levels from the comparison of survival curves using the Log-rank test.
Official websites use .gov
A
.gov website belongs to an official
government organization in the United States.
Secure .gov websites use HTTPS
A lock (
) or https:// means you've safely
connected to the .gov website. Share sensitive
information only on official, secure websites.
Kaplan-Meier survival curve for patients with wild-type EGFR stratified by (a) PS score, (b) disease type. P-value indicates significance levels from the comparison of survival curves using the Log-rank test.