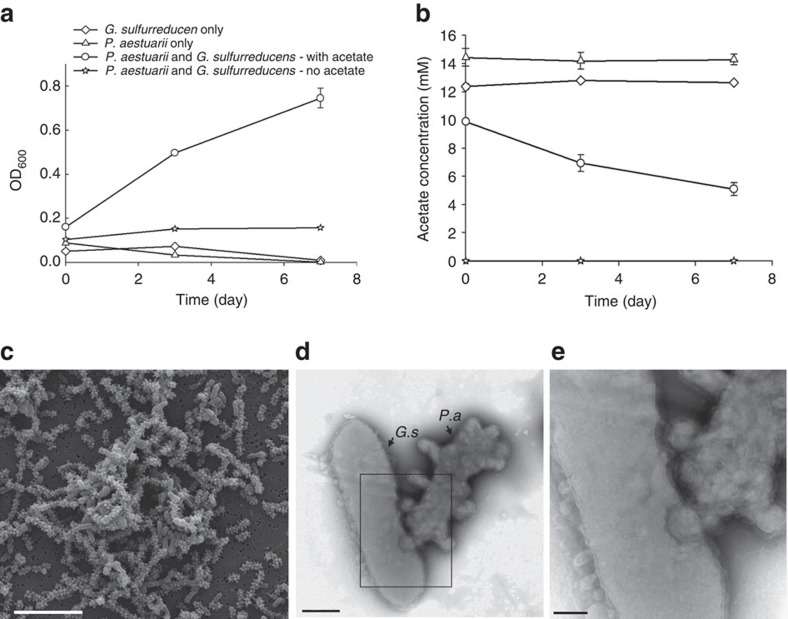
Figure 2. Syntrophic growth of G. sulfurreducens and P. aestuarii.
Variation in (a) cell density and (b) acetate consumption over time of P. aestuarii and G. sulfurreducens in axenic cultures and co-cultures. Each symbol is mean±s.d. (n=3). (c) SEM image of co-culture (scale bar, 5 μm). (d,e) TEM whole mount images of G. sulfurreducens (G.s) and P. aestuarii (P.a) co-cultures show two morphologically distinct species and their cell–cell contact via intimate extracellular associations (scale bars, 0.5 μm and 200 nm, respectively). These images are representative of the 20 SEM images and 26 TEM images obtained.

