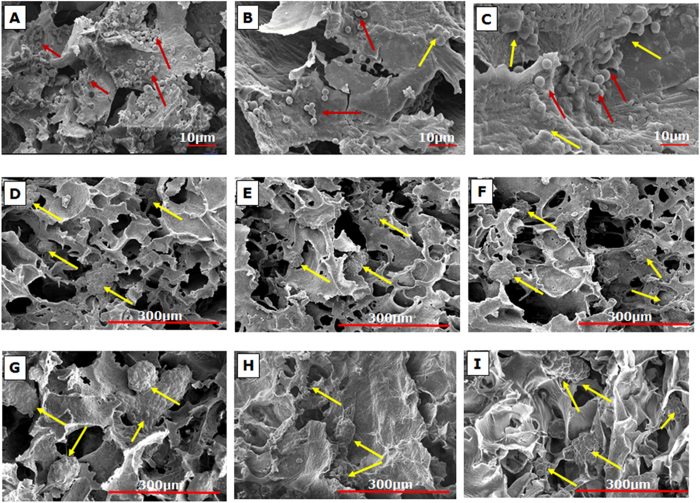
Figure 6. Scanning electron micrographs of cryogel bioreactors.
SEM images of the top (A), middle (B) and bottom (C) section of the monolith cryogel bioreactor used in System 1 at the end of extracorporeal run showing blood cell infiltration (red arrows); Negligible cell infiltration was observed in the left (D), middle (E) and right (F) sections of the cryogel disc used in System 2; Micrographs of the left (G), middle (H) and right (I) sections of unused cell-seeded bioreactor show spheroid formation of the hepatic cells (yellow arrows) on the cryogel matrix.

