
Figure 7.
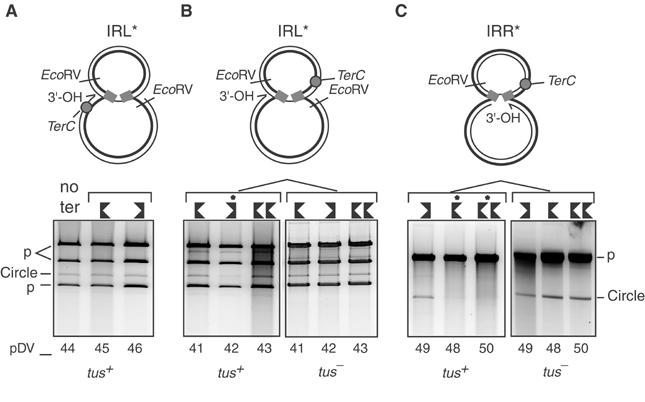
terC affects figure-eight resolution in a polar manner. IR donor mutants were used to obtain unique figure-eight populations and to orient the potential replication fork (A–C, top). The 1% agarose gels were stained with Sybr green. IRL* or IRR* donor mutants (A–C, bottom) were tested separately with different positions (shown as grey circles, top) and orientations of terC sites (shown by oriented black symbols, bottom; Table I). These were placed outside the transposon (pDV45 and 46 with IRL*; A) or inside the transposon with IRL* (pDV41, 42, 43; B) or with IRR* (pDV48, 49, 50; C). pDV43 and 50 harbour two terC sites in tandem. The right-hand panels (B, C) show the results obtained in a tus− strain. The major upper band marked p in (A, B) represents linearised pAPT111. The lower two bands marked p (A, B) represent two fragments generated from the transposon-carrying plasmids. Introduction of IRR* (C) resulting in the elimination of one of the two EcoRV sites from the parental plasmid pRP4 (Figure 5). These plasmids are therefore linearised by EcoRV and migrate at the same position as the linearised Tpase donor plasmid. The band corresponding to plasmid circles is also indicated. Additional minor bands migrate at positions consistent with partially digested products. Lanes in which transposon circle formation was delayed are indicated (*).