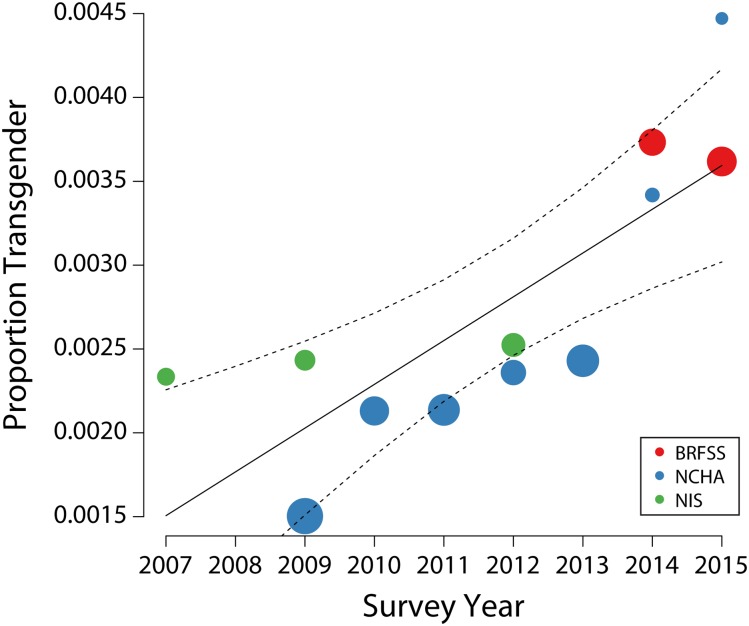
FIGURE 3—
Meta-Regression Showing the Proportion of Transgender Adults Against Survey Year, Based on Surveys That Categorized Transgender as Gender Identity: United States, 2007–2015
Note. BRFSS = Behavioral Risk Factor Surveillance System; NCHA = National College Health Assessment; NIS = National Inmate Survey. The 2016 NCHA was omitted as a potential outlier. Data points are scaled, with larger circles indicating smaller standard errors. The dashed lines indicate the 95% confidence interval about the regression line.

