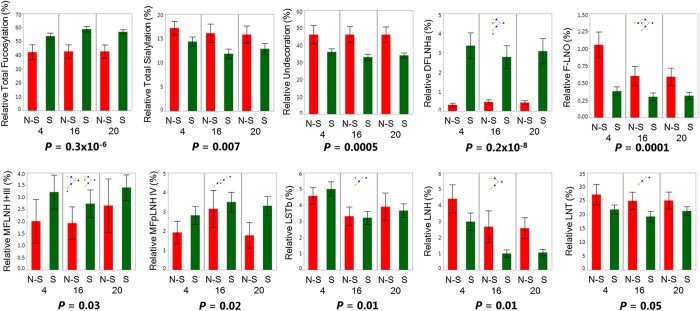
Figure 2. Differences in relative human milk oligosaccharide (HMO) classes and individual structure abundances between secretors and non-secretors.
Differences in relative human milk oligosaccharide (HMO) class and structure abundance between phenotypic secretors (S,  , N = 21) and non-secretors (N-S,
  , N = 12). Plots show averages for all mothers divided by time point (week 4, 16, and 20) with error bars representing standard error and P-values listed below each plot for overall differences based on Mann-Whitney U tests. Individual HMO structures pictured with monosaccharides Glc (
 ), Gal (
 ), GlcNAc (
 ), Fuc (
 ) and Neu5Ac (
 ).
).

