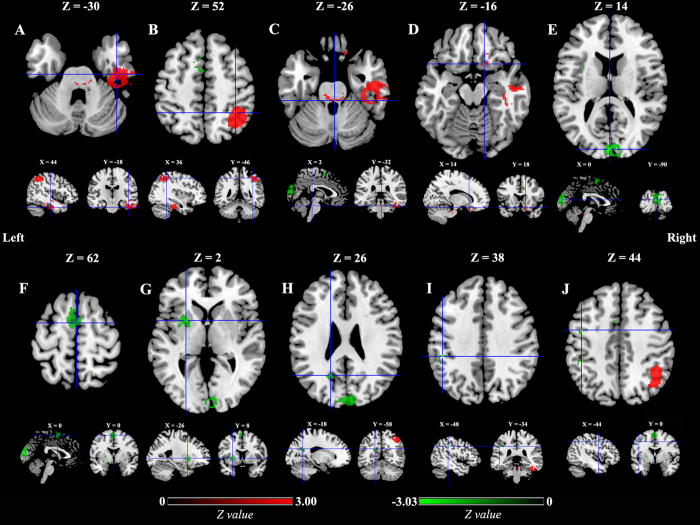
Figure 2. ALFF differences in patients with PD compared to healthy controls.
Key: Red and green colors indicate increased and decreased ALFFs in patients with PD compared to healthy controls, respectively. ALFF, amplitude of low-frequency fluctuations; (A), Right inferior temporal/middle temporal/fusiform/parahippocampal gyri; (B), Right inferior parietal gyrus; (C), Brainstem (pons and midbrain); (D), Right orbitofrontal cortex; (E), Left/Right cuneus cortices; (F), Left/Right supplementary motor areas; (G), Left putamen; (H), Left cuneus cortex; (I), Left inferior parietal gyrus; (J), Left lateral premotor cortex.

