
Figure 2. Tandem Mass Tag analysis of chromatome composition and gene ontology.
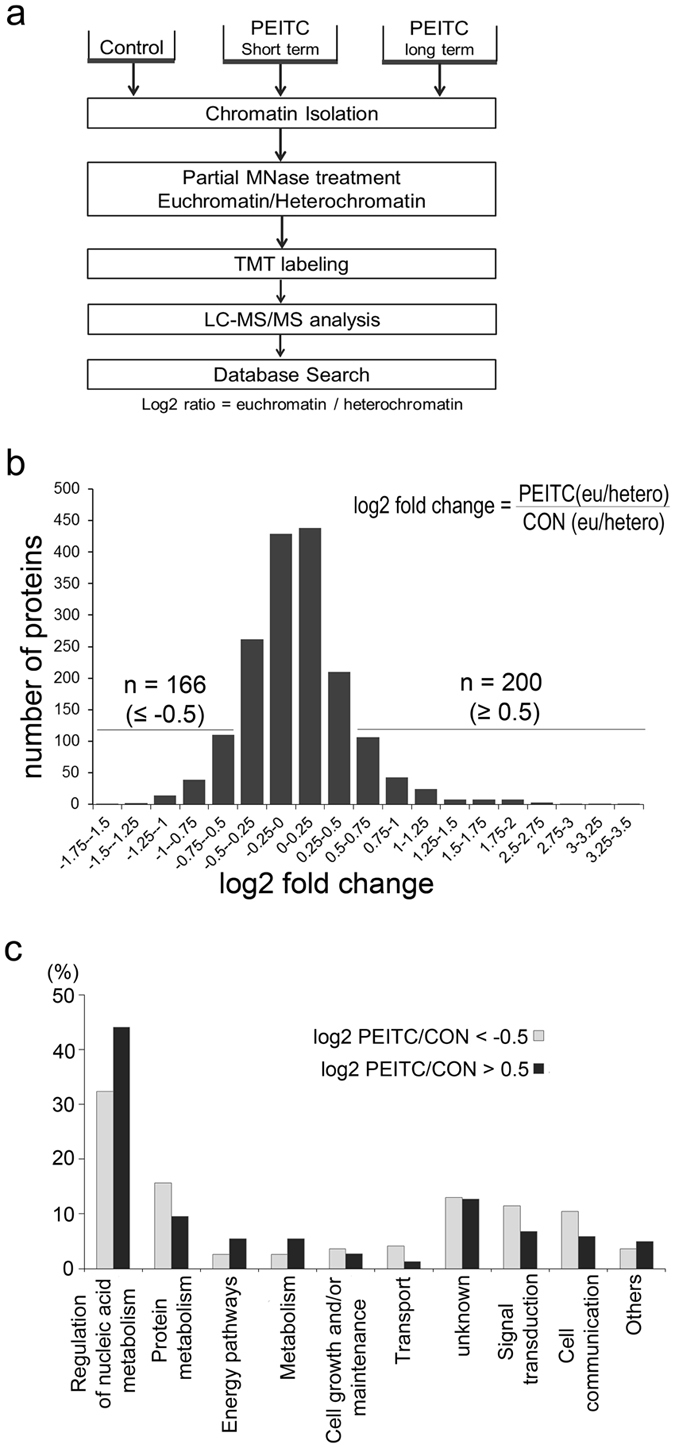
(a) Schematic outline of LC-MS/MS analytical method. Chromatin-binding proteins were isolated by partial MNase treatment and subsequently labeled with TMT tags. (b) Histogram representation of changes in protein binding to either euchromatin or heterochromatin in SW620 cells after long-term PEITC treatment (relative to vehicle-only control). Differentially regulated proteins displaying log2 fold-change ≤ −0.5/ ≥ 0.5 are indicated. (c) GO enrichment analysis of the corresponding biological processes is shown in the bar graph.