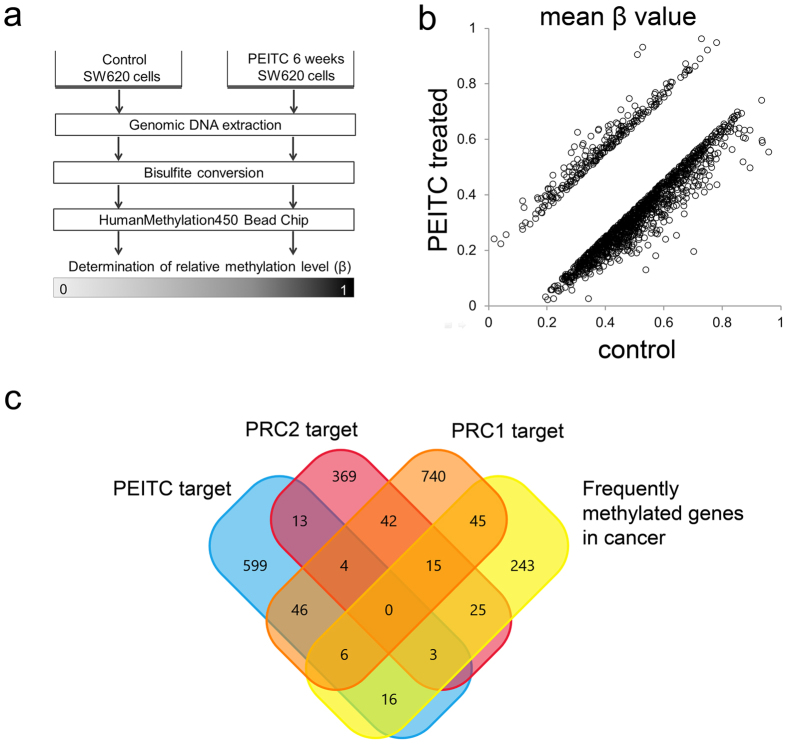
Figure 5. Differential DNA methylation pattern in PEITC-treated colon cancer cells.
(a) Schematic summary of DNA methylation analysis. Genomic DNA was extracted from SW620 cells that had been treated with either 2.5 μM PEITC or DMSO only for 6 weeks and then subjected to bisulfite conversion. The Illumina Infinium HumanMethylation450 bead chip was used for determination of relative methylation levels. (b) Differentially methylated genes (difference > |0.15|) were identified by comparing methylation intensity (mean β value) between SW620-CON and SW620-PEITC cells. (c) Venn diagram representing the overlap of PEITC targets with PRC1 and PRC2 targets as well as other genes that are frequently hypermethylated in cancer. Data were generated from two independent biological replicates.

