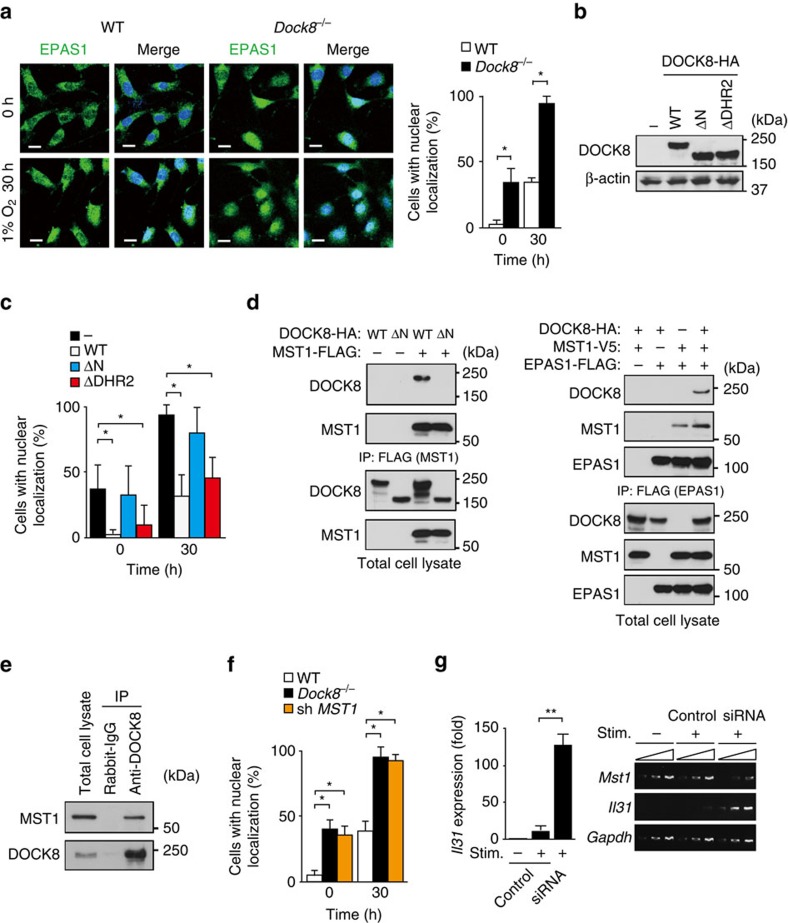
Figure 6. DOCK8 regulates nuclear translocation of EPAS1 via MST1 interaction.
(a) Immunofluorescence analyses for subcellular localization of EPAS1 in MEFs under steady and hypoxia conditions. DAPI was used to stain nuclei. Scale bars, 20 μm. The proportion of cells with nuclear localization of EPAS1 was compared between WT and Dock8−/− MEFs. In each experiment, 30 cells were counted per group. Data are expressed as mean±s.d. of 4 independent experiments. *P<0.05 (two-tailed Mann–Whitney test). (b,c) Comparison of nuclear localization of EPAS1 between Dock8−/− MEFs and those stably expressing HA-tagged WT DOCK8 or its mutants (ΔN and ΔDHR2). Western blot analysis was performed with anti-HA and anti-βactin antibodies. In each experiment, 30 cells were counted per group. Data are expressed as mean±s.d. of four independent experiments. *P<0.05 (two-tailed Mann–Whitney test). (d) Formation of DOCK8-MST1-EPAS1 molecular complex in HEK-293T cells. 24 h after transfection of the expression plasmids in HEK-293T cells, cell extracts were subjected to immunoprecipitation and immunoblotting. Data are representative of three separate experiments. (e) Association between DOCK8 and MST1 in activated CD4+ T cells. The cell extracts of activated CD4+ T cells were immunoprecipitated with anti-DOCK8 antibody or control rabbit IgG. Immunoblotting was carried out with anti-MST1 and anti-DOCK8 antibodies. Data are representative of three separate experiments. (f) Effect of Mst1 knock down on nuclear localization of EPAS1 in WT MEFs. In each experiment, 30 cells were counted per group. Data are expressed as mean±s.d. of four independent experiments. *P<0.05 (two-tailed Mann–Whitney test). (g) Effect of Mst1 knock down on Il31 gene expression in CD4+ T cells from Dock8+/− AND Tg mice. Expression (fold increase) is relative to that of the unstimulated samples. Data are expressed as mean±s.d. of 6 samples per group. **P<0.01 (two-tailed Student's t-test). Amplification increased by 2 cycles, from the left to the right, starting at 34 cycles for Mst1 and Il31 or at 29 cycles for Gapdh. See Supplementary Fig. 11b–d for uncropped scans of the westen blot.

