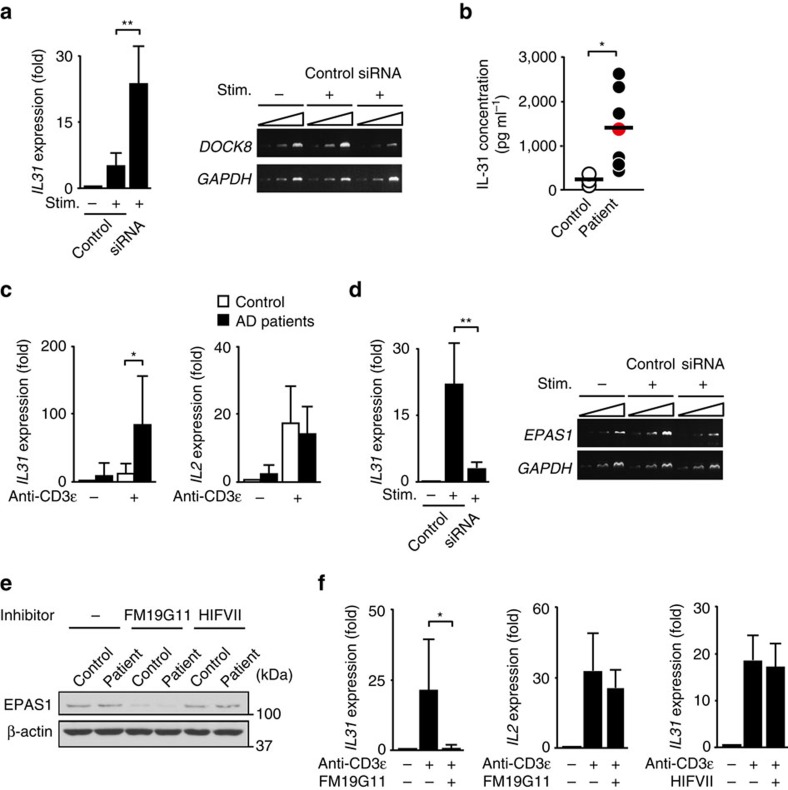
Figure 7. Role of DOCK8 and EPAS1 in IL-31 induction in human CD4+ T cells.
(a) Effect of DOCK8 knock down on TCR stimulation-induced IL31 gene expression in CD4+ T cells from healthy controls. Expression (fold increase) is relative to that of the unstimulated samples. Data are expressed as mean±s.d. of eight samples. **P<0.01 (two-tailed Student's t-test). Amplification increased by 2 cycles, from the left to the right, starting at 34 cycles for DOCK8 or at 29 cycles for GAPDH. (b) Comparison of serum IL-31 concentrations between healthy controls (n=6) and DOCK8-deficient patient (n=1; red circle) or AD patients (n=6). The lines indicate the mean values. *P<0.05 (two-tailed Student's t-test for comparison between AD patients and healthy controls). (c) TCR stimulation-induced cytokine gene expression in CD4+ T cells from AD patients (n=6) and healthy controls (n=6). Expression (fold increase) is relative to that of unstimulated healthy controls. Data are expressed as mean±s.d. *P<0.05 (two-tailed Mann–Whitney test). (d) Effect of EPAS1 knock down on IL31 gene expression in CD4+ T cells from AD patients. Expression (fold increase) is relative to that of the unstimulated samples. Data are expressed as mean±s.d. of 6 samples. **P<0.01 (two-tailed Mann–Whitney test). Amplification increased by 2 cycles, from the left to the right, starting at 34 cycles for EPAS1 or at 29 cycles for GAPDH. (e) Effect of on FM19G11 and HIFVII on EPAS1 expression in CD4+ T cells from AD patients and healthy controls. Data are representative of three separate experiments. See Supplementary Fig. 11e for uncropped scans of the Westen blot. (f) Effect of FM19G11 (n=6) and HIFVII (n=3) on TCR stimulation-induced cytokine gene expression in CD4+ T cells from AD patients. Expression (fold increase) is relative to that of AD patient samples without stimulation. Data are expressed as mean±s.d. *P<0.05 (two-tailed Student's t-test).

