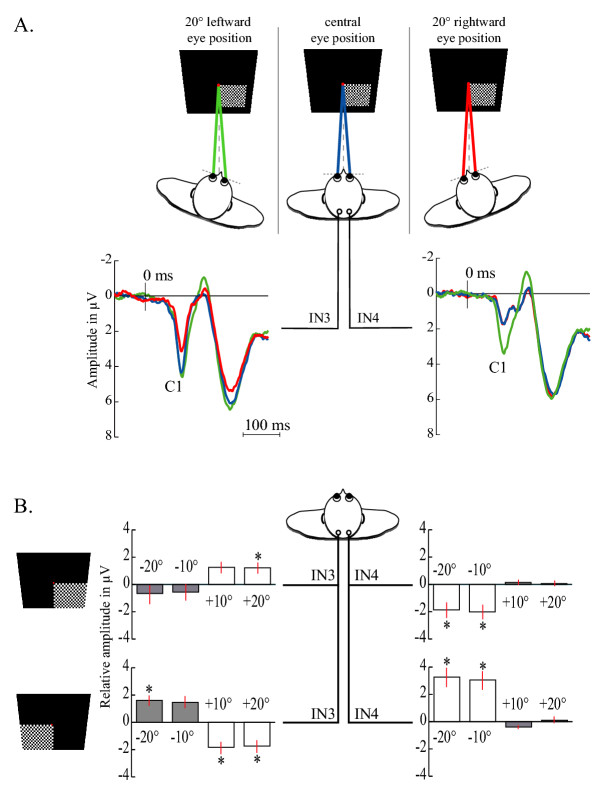
Figure 2.

A. Example of modulation of the C1 amplitude observed for both left- and right-ocular deviations of 20°. The grand averaged VEP over the 20 subjects and in response to stimuli in the lower quadrants of the right visual field is presented at each lateral site (IN3, IN4) for central eye position (blue) and, 20° leftward (green) and 20° rightward (red) eye positions. B. Comparison of the difference of C1 amplitudes between each deviated eye position and the central eye position for both left and right lower quadrant field. For each subject, the C1 amplitude calculated for each eye position was subtracted from the C1 amplitude measured for the central eye position. Vertical bars represent the standard error of the mean.
