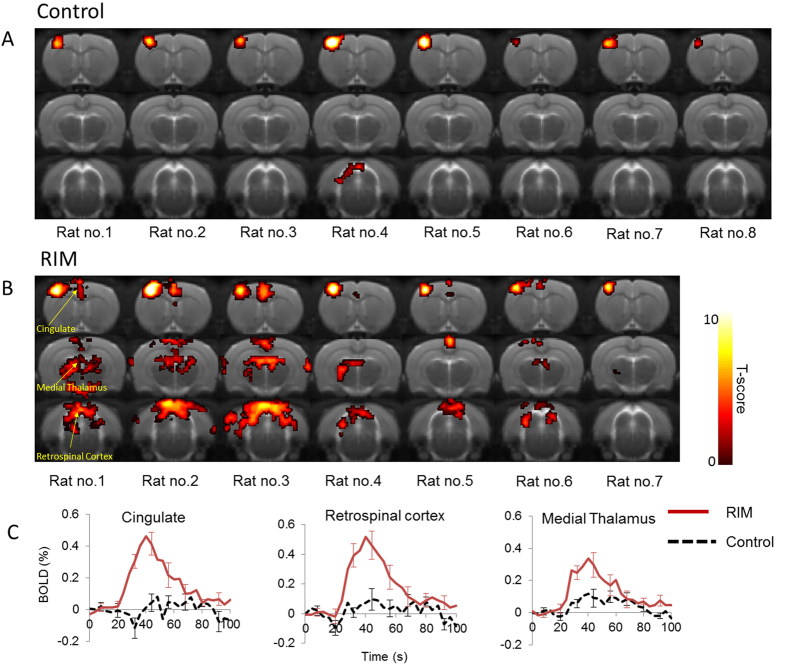
Figure 2.
BOLD activation maps to “moderate” electrical forepaw stimulation across 3 coronal slices within each of the individual subjects for the control (A) and RIM (B) cohort (p < 0.001, nv = 5). The activation maps are overlaid on a T2-weighted MRI rat brain atlas. The BOLD timeseries data within the anatomically defined regions are also shown (C).

