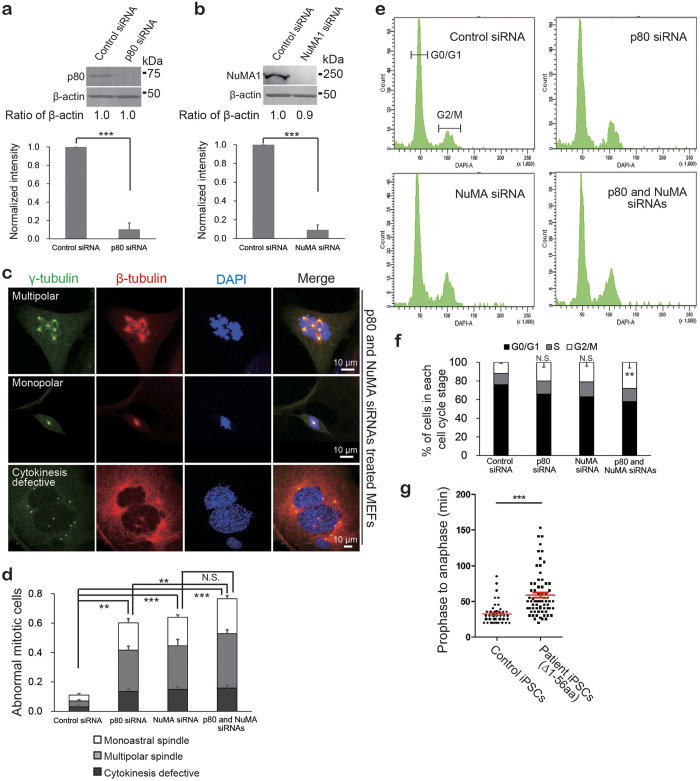
Figure 3. Mitotic-defective phenotypes caused by depletion of p80 or NuMA in MEF cells.
(a,b) siRNA-mediated knockdown of p80 (a) and NuMA (b) in MEF cells. All siRNA-transfected MEF cell lysates were analyzed via WB using antibodies against p80, NuMA and β-actin. Lower quantitative graphs (n = 3) indicate that siRNA treatment effectively decreased p80 (a) or NuMA (b) expression in both cases. β-Actin was used as a loading control. (c,d) Abnormal mitotic phenotypes in p80 (Supplementary Fig. S2a,b), NuMA (Supplementary Fig. S2c,d) or double depletion cells (c and Supplementary Fig. S2e) and their quantitative analysis (d). siRNA treated cells were stained with anti-γ tubulin antibody (green) to probe centrosomes/spindle poles and anti-β tubulin antibody (red) to probe MT skeletons. As indicated, cells with the depletion of the target proteins exhibited multipolar (upper panels) and monopolar (middle panels) spindles, accompanied by cytokinesis defects (lower panels). These aberrant mitotic phenotypes were analyzed to corroborate the functions of p80 and NuMA in the cell cycle. The results were obtained from three independent experiments, n = 329 for control, n = 352 for p80 siRNA, n = 310 for NuMA siRNA and n = 302 for both siRNA treatments (d). (e,f) Cell cycle profiles in target siRNA-treated MEF cells. Binucleated cells caused by siRNA were analyzed via FACS (e) and quantified (f), (n = 3). (g) Quantified data of prophase-to-anaphase length in control and patient iPSCs (Δ1-56 aa). Scale bar, 10 μm. P-values were calculated using Student’s t-test or analysis of variance (ANOVA), mean ± s.e., *P < 0.05, **P < 0.01, ***P < 0.001.

