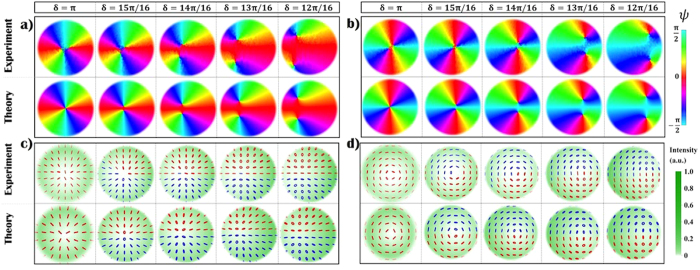
Figure 1. Instability of polarization singularities at the center of a VVB.
The instability of a V-point with topological charge η = 1 is investigated experimentally by changing the q-plate retardation with respect to the optimal condition δ = π. In panels a,b we plot the quantity  , that represents the orientation of polarization ellipses, for a radial (panel a) and an azimuthal (panel b) VVB. Colors associated with different values of ψ are shown in the figure legend. As visible in the figure labels, plots are obtained when varying δ in the range {12π/16, π} with steps of π/16. Importantly, C-points and V-points appear here as vortices of the complex scalar field S1 + iS2; as we decrease δ, two C-points clearly appear in the place of the V-point. As discussed in the main text, we are considering only a small area (of the order of w2/4, where w is the beam radius) at the center of the beam, where the singularity transformation is taking place. In (c,d), we show the corresponding experimental and theoretical polarization patterns associated with these fields. Here, red and blue colored ellipses are associated with left (s3 > 1) and right handed (s3 < 1) polarization states, respectively.

