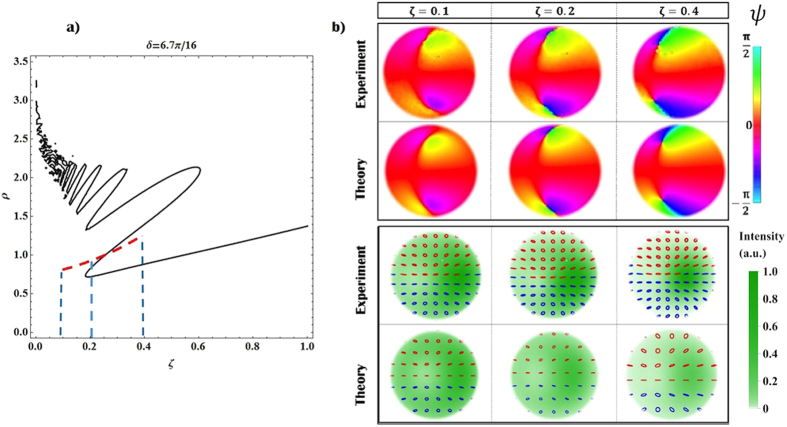
Figure 6. Dynamical formation of C-points.
Here we show that, for δ < π/2, C-points (absent in the near field) appear during propagation. In panel (a) we report the C-point position versus the longitudinal coordinate ζ in the case δ = 6.7π/16, for a H polarized input beam. The red line indicates the dimension of the regions investigated in the experiment while blue dashed lines show the corresponding values of ζ. In panel (b), we report the plot of the orientation angle ψ and the polarization pattern of the associated beam; here, theoretical simulations are added for comparison. Data refers to three different propagation distances, as reported in the plot: when ζ = 0.1, no singularities are visible in the polarization pattern; at ζ = 0.2, two C-point dipoles are clearly emerging, and a single pair is observed at ζ = 0.4. In the polarization plots, red and blue colored ellipses are associated with left (s3 > 1) and right handed (s3 < 1) polarization states, respectively.

