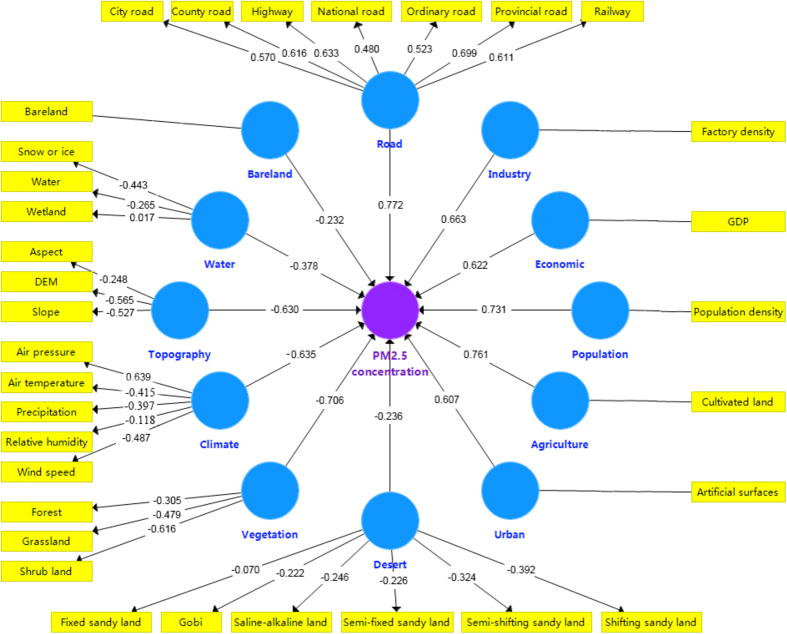
Figure 2. The correlation coefficients between latent geographic factors and PM2.5 concentrations.
The latent geographic factors under the blue circle, including “Road”, “Industry”, “Economic”, “Population”, “Agriculture”, “Urban”, “Desert”, “Vegetation”, “Climate”, “Topography”, “Water”, “Bareland”, were extracted from the variables in the yellow rectangle. For instance, “Climate” was based on “Air pressure”, “Air temperature”, “Precipitation”, “Relative humidity”, “wind speed”. For factors that contain multiple variables, the coefficients between blue circle and yellow rectangle directly are the contribution of the variables to PM2.5. Similarly, the coefficients between blue and purple circle are the contribution of the factors to PM2.5. For univariate factors, the coefficients between blue and purple circle are also the contribution of the variables to PM2.5.

