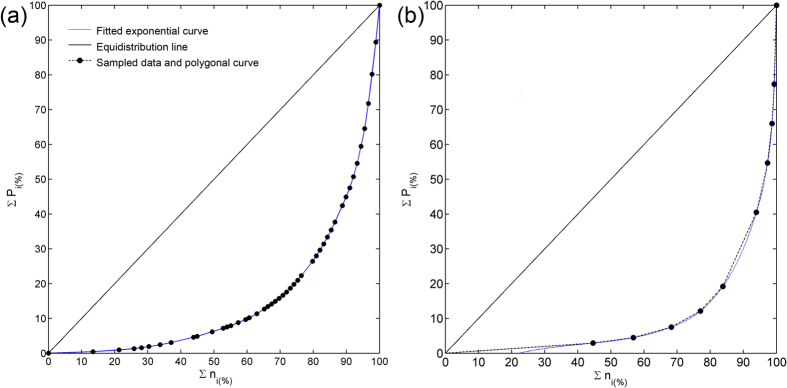
Figure 11. Flood and Climate concentration index.
Cumulative percentage ∑ni(%) of rainy days (a) and flood days (b) plotted against the cumulative percentage ∑Pi(%). of rainfall amounts (a) or flooded locations (b). The fitted exponential curve according to Eq.1 is also shown, as well as the equidistribution line.

