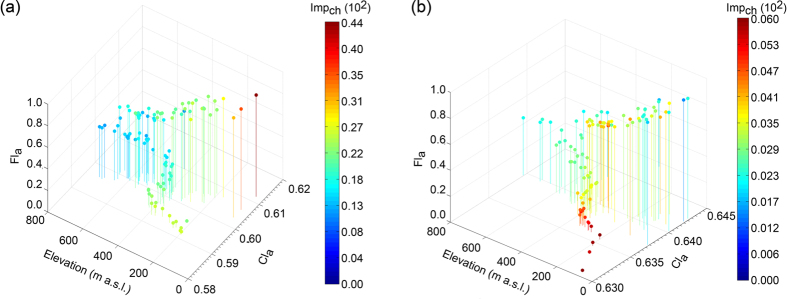
Figure 9.
Flood concentration (Fla) for 1970–1990 (a) and 1990–2010 (b) as related to the landscape topography (elevation m a.s.l.), climatic concentration -Cla -, and changes in imperviousness -Impch -. The percentage changes in imperviousness are shown as multiples of 102. Elevation was computed considering a Digital Elevation Model with a 50 m cell size. Thus they are an approximation of the actual elevation.

