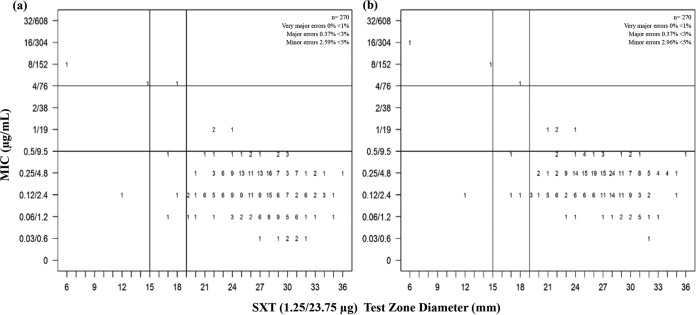
FIG 2.
Scattergrams of (a) SXT MIC and (b) SXD MIC versus SXT (1.25/23.75 μg) disk diffusion test zone diameter (in millimeters) for 270 S. equi isolates. Numbers represent the numbers of isolates at each MIC/test zone diameter pair. The horizontal and vertical lines represent MIC and disk diffusion cutoffs, respectively.

