
Figure 3.
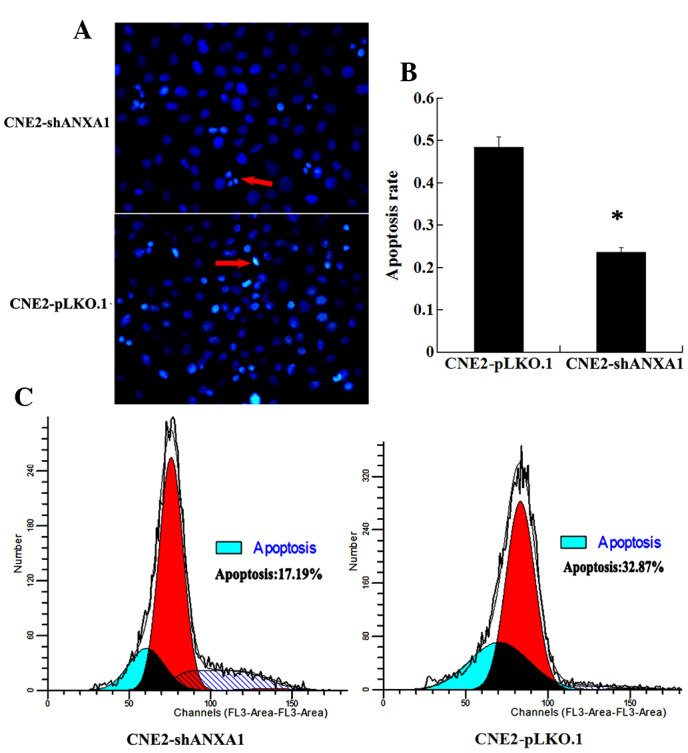
Different apoptotic rate of CNE2-shANXA1 and CNE2-pLKO.1 cells with radiation. (A) Hoechst 33258 staining of apoptotic cells. CNE2-shANXA1 and CNE2-pLKO.1 cells were exposed to 5-Gy irradiation, incubated for 72 h and then apoptosis was assessed using the cell-permeable DNA dye Hoechst 33258. The arrows indicate apoptotic nuclei with intense fluorescence corresponding to chromatin condensation. (B) A histogram showing the apoptotic rate of the two cell lines. Every sample was repeated three times. Data are presented as the mean ± standard deviation. (C) Flow cytometry analysis of apoptotic cells. CNE2-shANXA1 and CNE2-pLKO.1 cells were exposed to 5-Gy irradiation, incubated for 24 h and then assessed for apoptosis by flow cytometry. ANXA1, Annexin A1. *P<0.05; CNE2 shANXA1 vs. CNE2 pLKO.1.