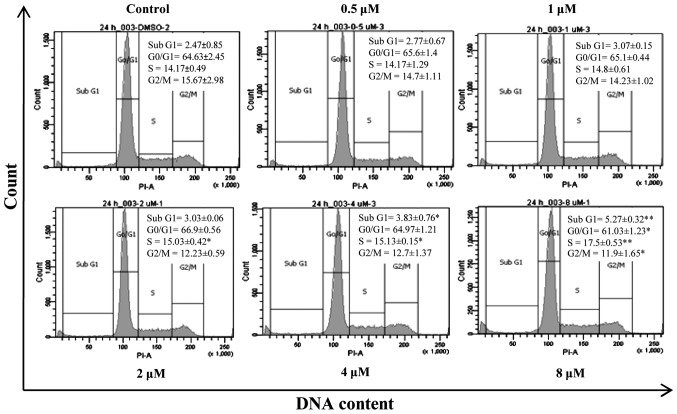
Figure 2.
Dose-dependent effect of forbesione on the cell cycle distribution of cultured Ham-1 cells. Cell cycle histogram of Ham-1 cells treated with different concentrations of forbesione (0, 0.5, 1, 2, 4 and 8 µM) for 24 h. Data are presented as the mean ± standard deviation of three independent experiments. *P<0.05, **P<0.01. PI-A, propoidum iodide-area; DMSO, dimethyl sulfoxide.

