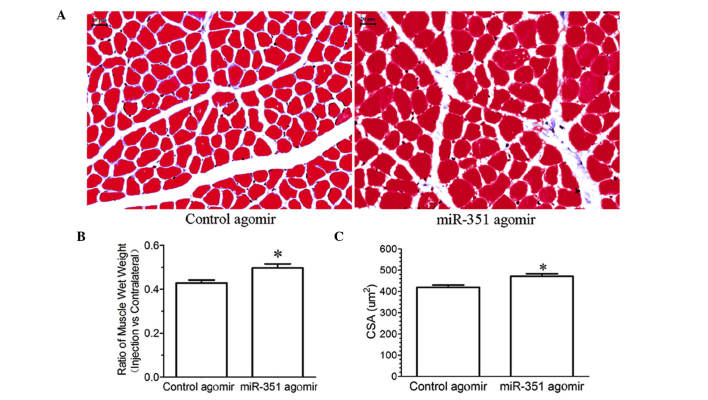
Figure 3.
(A) Masson's trichrome staining for determining the CSA of the TA muscle of rats injected with miR-351 agamir or control agamir. Scale bar = 20 µm; (B and C) Bar graphs showing the wet weight ratio and CSA of the TA muscle of rats injected with miR-351 agomir or control agomir. Data are presented as means ± standard deviation, n=8 per animal group. *P<0.05, vs. the control. CSA, cross-sectional area; TA, tibialis anterior.

