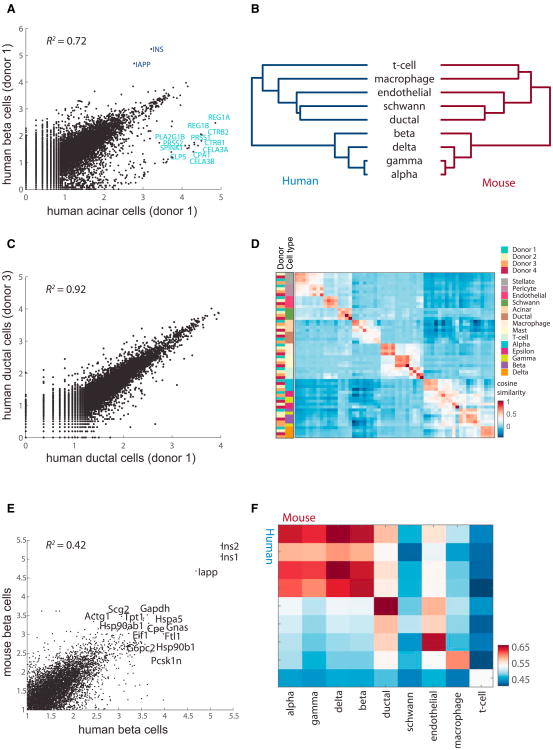
Figure 2. The Endocrine Transcriptome Is Readily Distinguished from the Other Cell Types and across Donors.
(A) Plot comparing the average expression (log10, transcripts per million [tpm]) of donor 1 beta and acinar cells. Genes with high differential expression are noted.
(B) Dendrogram showing relationships among the cell types in human (left) and mouse (right). The dendrogram was computed using hierarchical clustering with average linkage on the log10 tpm values of the highly variable genes.
(C) Same as (A) for the ductal cells of donors 1 and 3.
(D) Heatmap indicating correlations on the averaged profiles among donors for all cell types (STAR Methods).
(E) Same as (A) for human beta cells of donor 1 and mouse beta cells of mouse 1.
(F) Heatmap indicating Pearson's correlations on the averaged profiles among common cell types for human and mouse.

