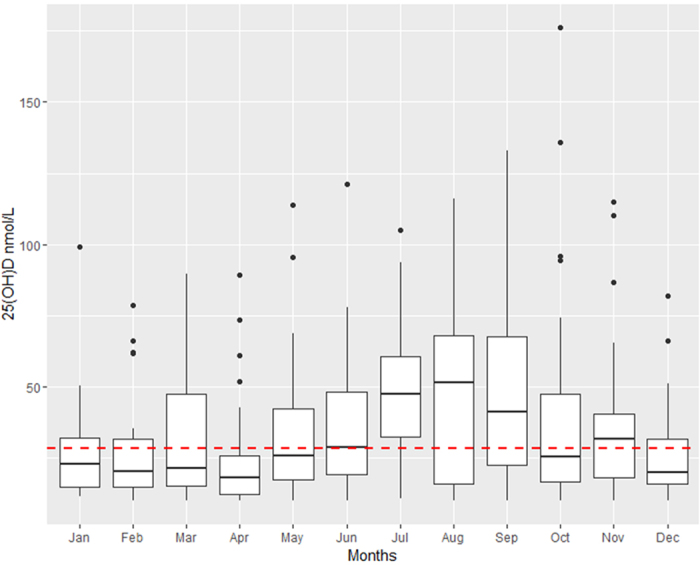
Figure 2. Course of 25(OH)D (nmol/L) during the year.

Red dashed line = overall median 25(OH)D level; boxplots = median with Q1 and Q3, black circles = outliers, January: 22.8 nmol/L (14.8–32.2), February: 20.4 nmol/L (14.7–31.6), March: 21.3 nmol/L (15.2–47.5), April 18.0 nmol/L (12.1–25.8), May: 26.0 nmol/L (17.5–42.3), June: 28.8 nmol/L (19.3–48.2), July: 47.5 nmol/L (32.6–60.7) August: 51.4 nmol/L (15.9–67.9), September: 41.4 nmol/L (22.4–67.7), October: 25.6 nmol/L (16.8–47.5), November: 31.8 nmol/L (18.0–40.5), December: 20.2 nmol/L (16.0–31.9).
