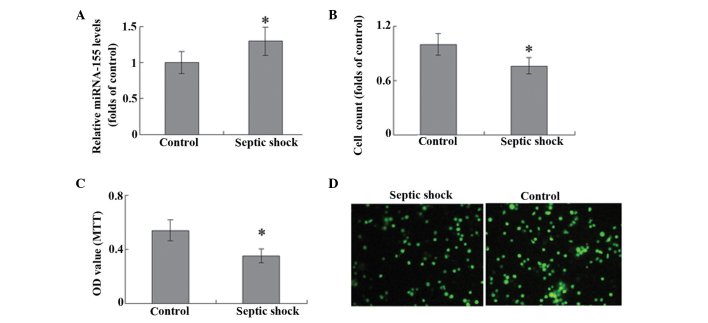
Figure 1.
T cells were isolated from peripheral blood samples and stimulated with 10 µg/ml phytohemagglutinin. (A) miRNA-155 expression levels were detected using reverse transcription-quantitative polymerase chain reaction analysis. (B) Cell proliferation was evaluated using cell counting, (C) methyl thiazolyl tetrazolium (MTT) assay and (D) immunofluorescence staining of proliferating cell nuclear antigen. Magnification, ×100. *P<0.05 vs. the control (n=6). miRNA, microRNA; OD, optical density.

