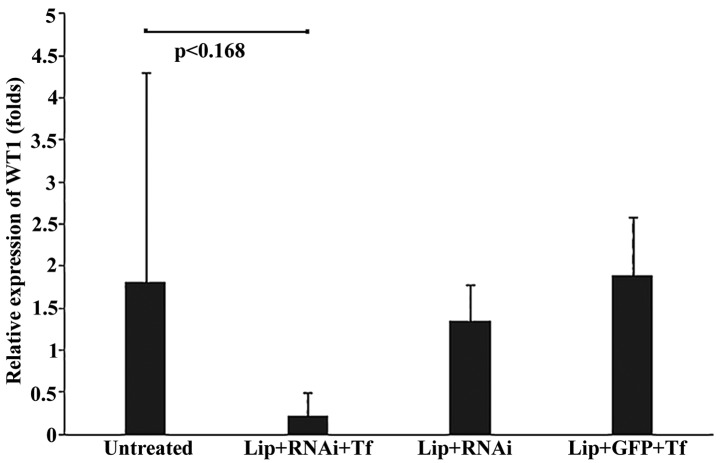
Figure 4.
Analysis of WT1 expression in mouse tumor tissues. Figure presents the mean relative expression folds of WT1 in samples analyzed of the different groups of mice used in the in vivo model. Quantitative polymerase chain reactions were run in duplicate and β-actin was used as an endogenous gene. Data are expressed as the mean including standard deviation, and the statistical value were included in the graph (P<0.168).

