
Figure 2.
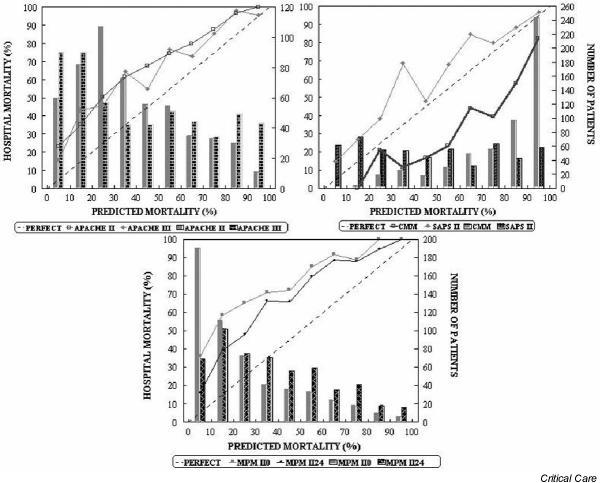
Calibration curves for the six severity-of-illness scores (solid lines) for the sample (excluding scheduled surgical patients; n = 542). The diagonal dotted line represents the line of ideal prediction. Columns represent the number of patients in each stratum (10% of probability). APACHE, Acute Physiology and Chronic Health Evaluation; CMM, Cancer Mortality Model; MPM, Mortality Probability Model; SAPS, Simplified Acute Physiology Score.