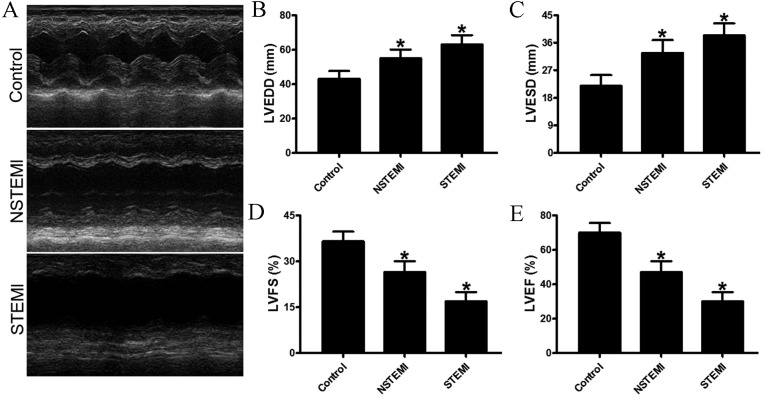
Figure 3.
Echocardiographic evaluation of cardiac function. (A) Representative M-mode echocardiogram data of infarcted hearts of the control group, and NSTEMI and STEMI subgroups at day 7. (B and C) Comparison of LVEDD and LVESD between control group, NSTEMI subgroup and STEMI subgroup. (D and E) Quantitative analysis of LVFS and LVEF among the three groups. Compared with the control, the patients in the STEMI subgroup exhibited significantly accentuated heart function according to the LVEF values. *P<0.05 vs. control. AMI, acute myocardial infarction; STEMI, ST segment elevation MI; NSTEMI, non-ST segment elevation MI; hs-CRP, high-sensitivity C-reactive protein; LVEDD, left ventricular end-diastolic diameter; LVESD, left ventricular end-systolic diameter; LVFS, left ventricular fractional shortening; LVEF, left ventricular ejection fraction.

