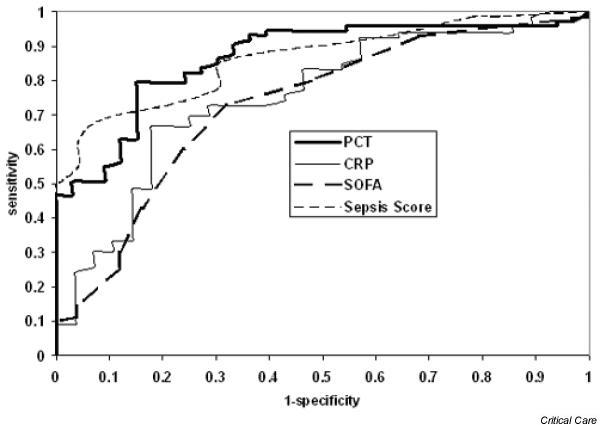
Figure 2.

Receiver operating characteristic (ROC) curves (95% confidence interval) for the prediction of sepsis/SS; the trauma group was excluded (diagnosis at admission was obvious). Procalcitonin (PCT) (thick solid line), 0.866 (0.79–0.93) (standard error, 0.04; P < 0.001); best cut-off, 1.11 ng/ml; sensitivity, specificity, negative predictive value (NPV), and positive predictive value (PPV), 79, 85, 92, and 65. Sepsis score (thin dashed line), 0.862 (0.78–0.93) (standard error, 0.04; P < 0.001); best cut-off, 5.5; sensitivity, specificity, NPV, and PPV, 66, 71, 66, and 71. C-reactive protein (CRP) (thin solid line), 0.755 (0.64–0.86) (standard error, 0.05; P < 0.001); best cut-off, 128 mg/l; sensitivity, specificity, NPV, and PPV, 67, 82, 90, and 51. Sequential organ failure assessment (SOFA) score (thick dashed line), 0.731 (0.61–0.84) (standard error, 0.06; P < 0.001); best cut-off, 4.5; sensitivity, specificity, NPV, and PPV, 73, 68, 86, and 47.
