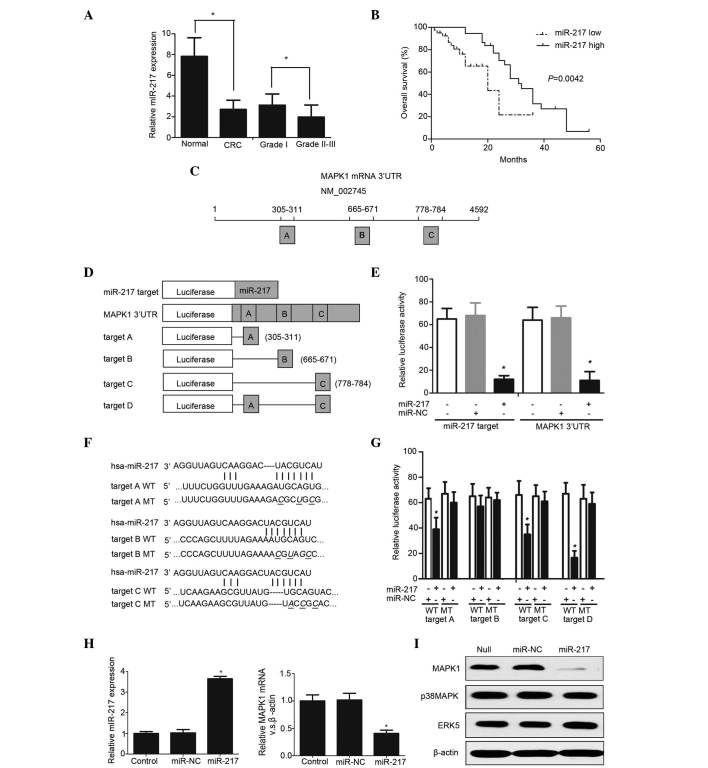
Figure 1.
(A) miR-217 levels of were measured in CRC specimens by RT-qPCR. *P<0.05. (B) Kaplan-Meier survival curves according to miR-217 expression. *P=0.0042. (C) Chart of MAPK1 mRNA sequence. Predicted consequential pairing of MAPK1 region: Region A, positions 395–401 of MAPK1 3′ UTR; region B: positions 665–671 of MAPK1 3′ UTR; region C, positions 778–784 of MAPK1 3′ UTR. (D) Schematic diagram of luciferase reporter constructs transfected into RKO cells. (E) Luciferase reporter plasmids were co-transfected into RKO cells, and the relative luciferase activity was determined. *P<0.05. (F) Sequence of wild type and mutant miR-217 target sites in the MAPK1 3′ UTR. (G) The contribution of the three miR-217 target sites was measured by a luciferase reporter assay *P<0.01. (H) The expression level of miR-217 was measured in stably expressing subclones by TaqMan® MicroRNA Assay. RT-qPCR demonstrated that MAPK1 mRNA was significantly decreased in RKO cells transfected with miR-217 compared with mock- and miR-NC-transfected cells. *P<0.05. (I) Western blot analysis revealed that miR-217 specifically repressed MAPK1 protein expression without influencing the expression of the other MAP kinase family members (p38 MAPK and ERK5). miR, microRNA; CRC, colorectal cancer; MAPK, mitogen-activated protein kinase; mRNA, messenger RNA; UTR, untranslated region; NC, negative control; hsa, Homo sapiens; WT, wild type; MT, mutant; ERK, extracellular signal-regulated kinase; RT-qPCR, reverse transcription-quantitative polymerase chain reaction.

