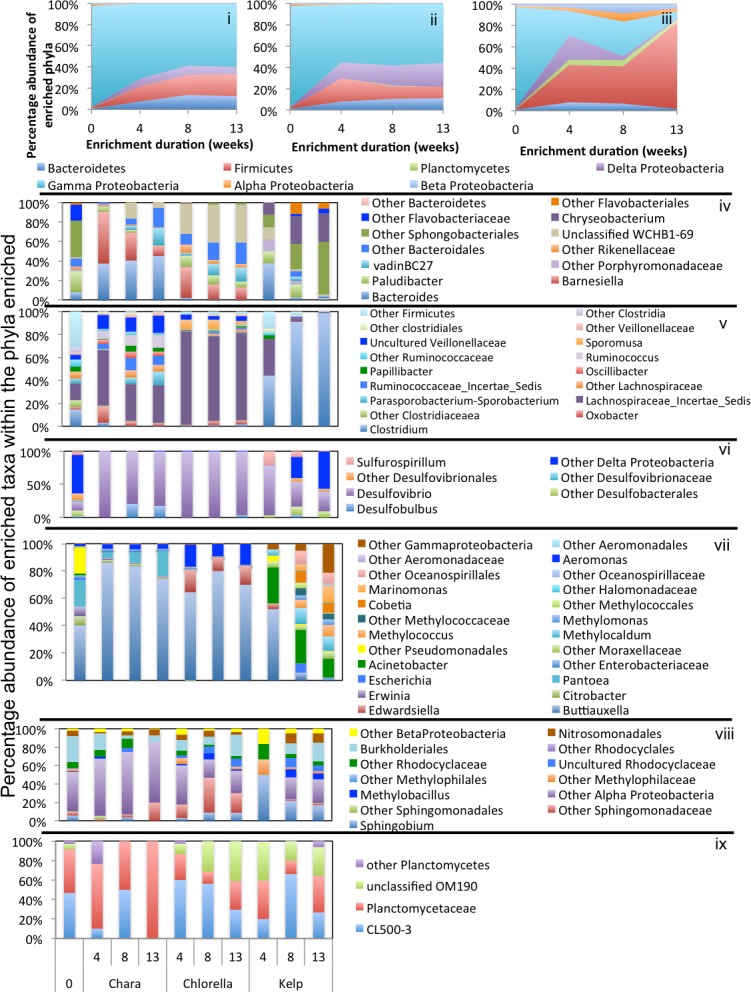
Figure 5. Microbial community composition in GL enrichments.

Abundant phyla/classes are shown as area charts for Chara (i), Chlorella (ii), and Kelp (iii) enrichments for each inoculum source. Phyla that constituted 5% or more of the community at any time during enrichment were considered significant to the degradation process and are shown in the area charts. These include phyla that were abundant prior to enrichment and remained abundant during and after enrichment (Gamma-Proteobacteria in Chara and Chlorella enrichments (i, ii)), and phyla that significantly and progressively increased in abundance with enrichment time (e.g., Firmicutes in Kelp enrichments (iii)). Bar charts depict the relative abundance of abundant genera (>1%) in each of the abundant phyla/classes shown in i-ii-iii. These include Bacteroidetes (iv), Firmicutes (v), Delta and Epsilon-Proteobacteria (vi), Gamma-Proteobacteria (vii), Alpha and Beta Proteobacteria (viii), and Planctomycetes (ix). The X-axis denotes the weeks of enrichment (i–iii), or the weeks of enrichment and algae type (iv–ix). “0” denotes the community composition in the pre-enrichment inoculum source.
