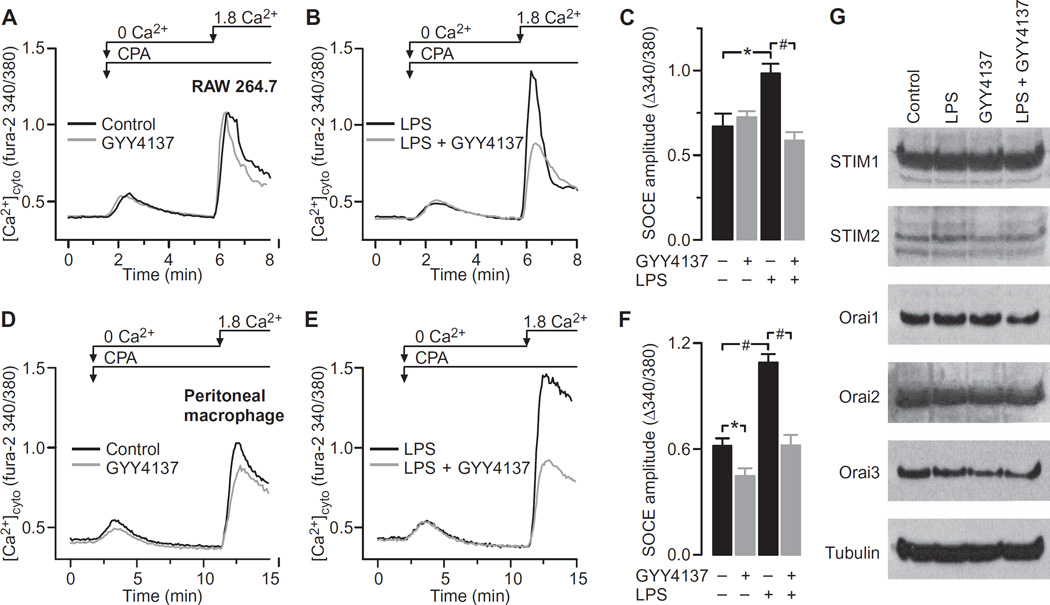
Fig. 3. GYY4137 blocks the LPS-induced increase in SOCE.
(A to F) Analysis of cytosolic Ca2+ flux in RAW264.7 cells and freshly isolated mouse peritoneal macrophages. To activate maximal SOCE, ER stores were depleted by the application of 10 µM CPA in the absence of extracellular Ca2+. Note that the area under the transient increase in [Ca2+]cyto in response to CPA is an index of resting ER store content, whereas the amplitude of the Ca2+ spike evoked upon adding Ca2+ back to the buffer reflects the magnitude of SOCE. (A) Typical traces recorded in RAW264.7 cells and depicting SOCE in the presence or absence of 500 µM GYY4137. (B) Measurement of SOCE in RAW264.7 cells treated for 4 hours with LPS (1 µg/ml) in the absence or presence of 500 µM GYY4137. (C) SOCE amplitudes in RAW264.7 cells treated under the indicated conditions. Data are means ± SEM of five to eight independent experiments. *P = 0.005, #P < 0.001 by one-way ANOVA. (D) Typical traces recorded in mouse peritoneal macrophages and depicting SOCE in the presence or absence of 500 µM GYY4137. (E) Traces showing SOCE recorded in peritoneal macrophages after stimulation with LPS (1 µg/ml) in the absence or presence of 500 µM GYY4137. (F) SOCE amplitude in peritoneal macrophages treated under the indicated conditions. Data are means ± SEM of five to seven independent experiments. *P = 0.029, #P < 0.001 by one-way ANOVA. (G) RAW264.7 cells were treated for 4 hours with the indicated combinations of vehicle, LPS (1 µg/ml), or 500 µM GYY4137. Cells were then analyzed by Western blotting with antibodies against the indicated proteins. Western blots are representative of three independent experiments. For quantification of band intensities, see fig. S2.

