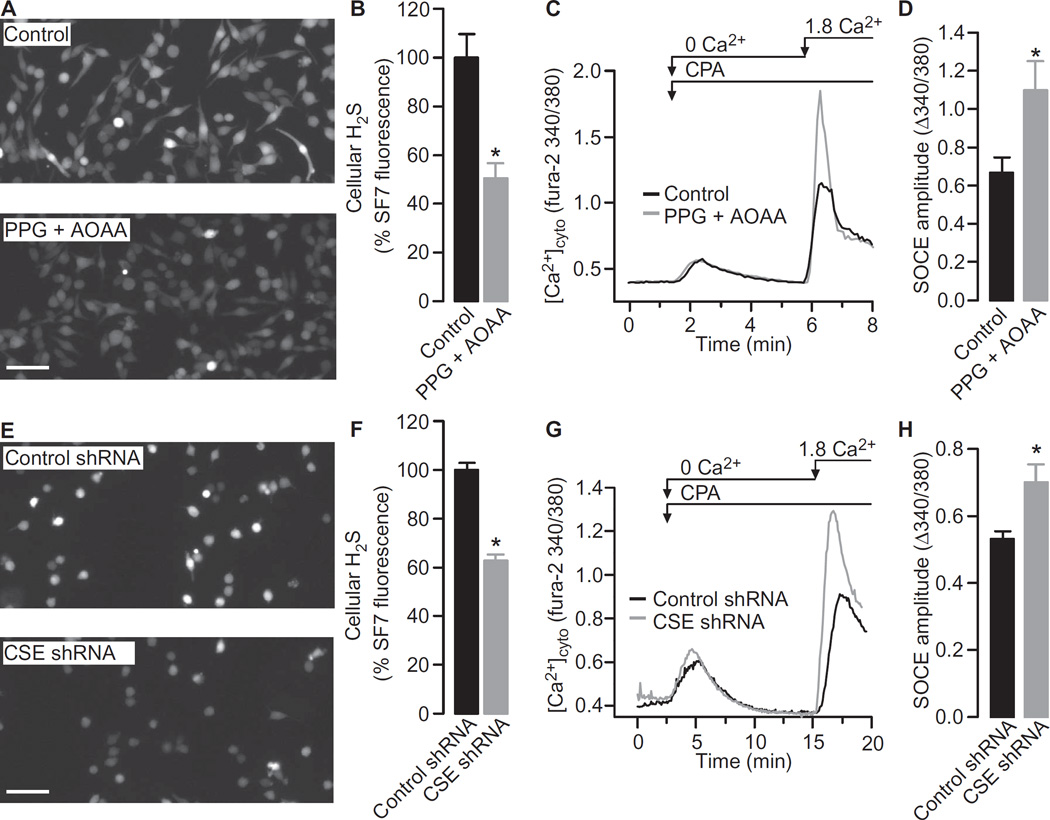
Fig. 4. Inhibition of H2S production increases SOCE in unstimulated RAW264.7 cells.
(A) RAW264.7 cells loaded with the H2S indicator SF7-AM were incubated for 1 hour either with vehicle control (top) or with 0.4 mM PPG and 0.4 mM AOAA (bottom). Cells were then analyzed by fluorescence microcopy. Images are representative of six independent experiments. Scale bar, 50 µm. (B) Quantification of the SF7-AM fluorescence in RAW264.7 cells. Data are means ± SEM of the SF7-AM fluorescence intensities of individual cells expressed as a percentage of control cells from six independent experiments. *P = 0.005 by unpaired t test. (C) Typical SOCE traces in RAW264.7 cells in the presence or absence of both PPG and AOAA were recorded as described in Fig. 3A. (D) SOCE amplitudes in RAW264.7 cells in the presence or absence of both PPG and AOAA. Data are means ± SEM of five to seven independent experiments. *P = 0.023 by unpaired t test. (E) RAW264.7 cells stably expressing control shRNA (top) or CSE-specific shRNA (bottom) were loaded with the H2S indicator SF7-AM. Cells were then analyzed by fluorescence microcopy. Images are representative of four independent experiments. Scale bar, 50 µm. (F) Quantification of the effect of CSE knockdown on SF7-AM fluorescence in RAW264.7 cells. Data are means ± SEM of the SF7-AM fluorescence intensities of individual cells expressed as a percentage of control cells from four independent experiments. *P < 0.001 by unpaired t test. (G) Typical SOCE traces in RAW264.7 cells treated with control shRNA or CSE-specific shRNA were recorded as described in Fig. 3A. (H) Effect of CSE knockdown on SOCE amplitudes in RAW264.7 cells. Data are means ± SEM of five independent experiments. *P = 0.015 by unpaired t test.

