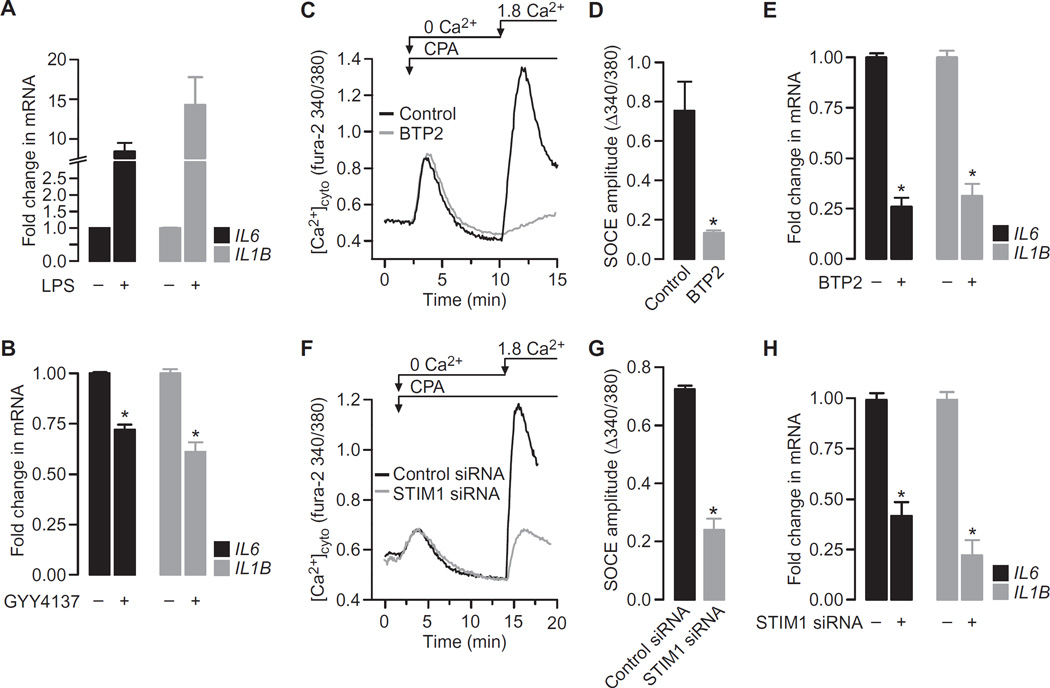
Fig. 5. Increasing the cellular concentration of H2S or inhibiting SOCE attenuates proinflammatory cytokine production by LPS-treated RAW264.7 cells.
(A) RAW264.7 cells were treated for 4 hours with vehicle or LPS (1 µg/ml) before being analyzed by qRT-PCR to determine the relative abundances of the indicated mRNAs. (B) RAW264.7 cells treated for 4 hours with LPS (1 µg/ml) in the presence or absence of 500 µM GYY4137 were analyzed by qRT-PCR to determine the relative abundances of the indicated mRNAs. (C) Typical SOCE traces in RAW264.7 cells in the presence or absence of 10 µM BTP2 were recorded as described in Fig. 3A. (D) SOCE amplitudes in RAW264.7 cells in the presence or absence of BTP2. (E) RAW264.7 cells treated for 4 hours with LPS (1 µg/ml) in the presence or absence of 10 µM BTP2 were analyzed by qRT-PCR to determine the relative abundances of the indicated mRNAs. (F) Typical SOCE traces in RAW264.7 cells treated with control siRNA or STIM1-specfic siRNA were recorded as described in Fig. 3A. (G) SOCE amplitudes in RAW264.7 cells treated with control siRNA or STIM1-specfic siRNA. (H) RAW264.7 cells treated with control siRNA or STIM1-specific siRNA were analyzed by qRT-PCR to determine the relative abundances of the indicated mRNAs. Data in all bar charts are means ± SEM of at least three independent experiments. *P < 0.001 by unpaired t test.

