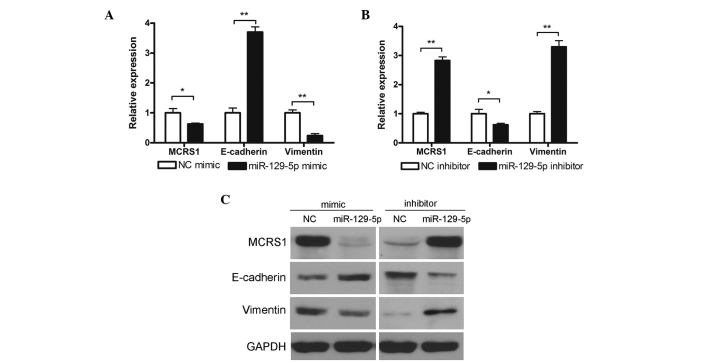
Figure 5.
miR-129-5p modulation of MCRS1, E-cadherin and Vimentin mRNA and protein expression levels. A549 cells were treated (A) with or without miR-129-5p mimic or (B) with or without miR-129-5p inhibitor and mRNA levels of MCRS1, E-cadherin and Vimentin were subsequently determined by reverse transcription-quantitative polymerase chain reaction analysis. Data are presented as the mean ± standard deviation of three independent experiments. *P<0.05; **P<0.01. (C) A549 cells were treated with or without miR-129-5p mimic or inhibitor and protein levels of MCRS1, E-cadherin and Vimentin were subsequently determined by western blot analysis. Representative results of three independent experiments are shown. MCRS1, microspherule protein 1; NC, negative control.

