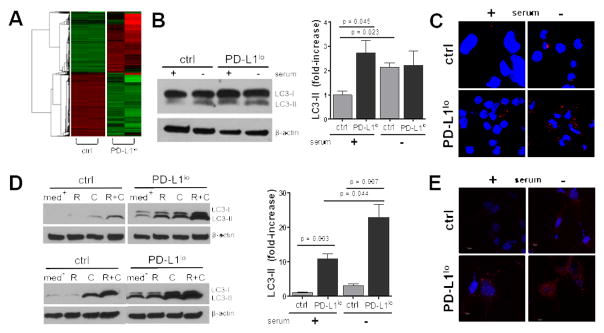
Figure 3. PD-L1 regulates tumor autophagy genes and functions.
A. RNA was isolated from in vitro cultured control or PD-L1lo ID8agg cells and global genes were assessed using David Bioinformatics. 5.8E-10, 5.8 x 10⁻¹⁰, etc. B. Western blot of lysed ID8agg cells from basal (+) or serum starved (−) (24 h) conditions (left). Right, summary data of three independent experiments. p-values, unpaired t test. C. Confocal images of autophagosome formation by LC-3 aggregation (red) in control versus PD-L1lo ID8agg under basal or serum starved (24 h) conditions. Blue, DAPI for nuclei. D. Analyses of B16 cells as in B, (med + or − for basal and serum starved conditions, respectively) treated with rapamycin (R) for 16 h, chloroquine (C) for 6 h or both. E. Confocal images of autophagosome formation for control versus PD-L1lo B16 as in C.

