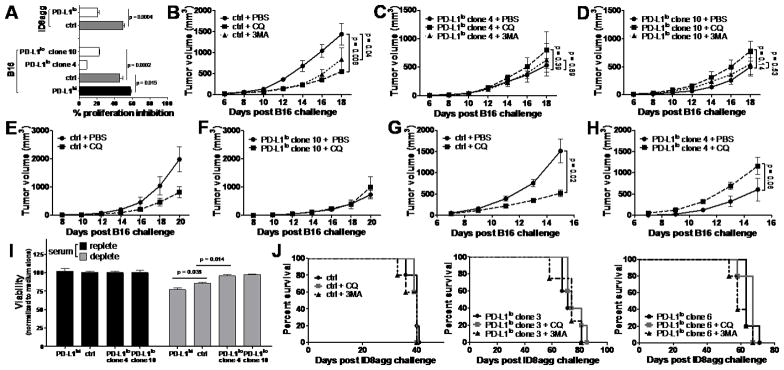
Figure 4. Tumor PD-L1 regulates response to pharmacologic autophagy inhibitors.
A. Indicated cells were cultured with 50 μM chloroquine and proliferation inhibition (100%-% proliferation by MTT, with control set at 0%) assessed 72 h later. P values from unpaired t test. B-D, wild type mice challenged with indicated cells and treated with chloroquine (CQ) or 3-methyladenine (3MA) as described in Materials and Methods. p-values, two-way ANOVA. PBS, phosphate buffered saline control. E-F. βδ TCR KO mice challenged and treated as in B-D. G-H. NSG mice challenged and treated as in B-D. I. Indicated B16 cells from basal (+) or serum starved (−) (24 h) conditions and cell viability normalized to basal controls assessed on a Vi-Cell. P values from unpaired t test. J. WT females challenged with indicated ID8agg, 4 x 10⁶ cells intraperitoneally, and treated with chloroquine or 3MA as in panels B-D. No differences are significant.

